

The broad stock market has further extended its medium-term uptrend in the last five trading days (August 12 - August 18). The S&P 500 index has set new record high of 3,395.06 on Tuesday, as it got slightly above February 19 high of 3,393.52. More than four months ago on March 23, the market sold off to new medium-term low of 2,191.86. It was a stunning 35.4% below February 19 record high of 3,393.52. The corona virus and economic slowdown fears erased more than a third of the broad stock market value. Since then stocks rallied 54.9%.
The S&P 500 index has gained 1.02% between August 12 and August 18. In the same period of time our five long and five short stock picks have lost 2.83%. So stock picks were relatively weaker than the broad stock market. Our long stock picks have lost 2.88% and short stock picks have resulted in a loss of 2.78%.
There are risks that couldn't be avoided in trading. Hence the need for proper money management and a relatively diversified stock portfolio. This is especially important if trading on a time basis - without using stop-loss/ profit target levels. We are just buying or selling stocks at open on Wednesday and selling or buying them back at close on the next Tuesday.
If stocks were in a prolonged downtrend, being able to profit anyway, would be extremely valuable. Of course, it's not the point of our Stock Pick Updates to forecast where the general stock market is likely to move, but rather to provide you with stocks that are likely to generate profits regardless of what the S&P does.
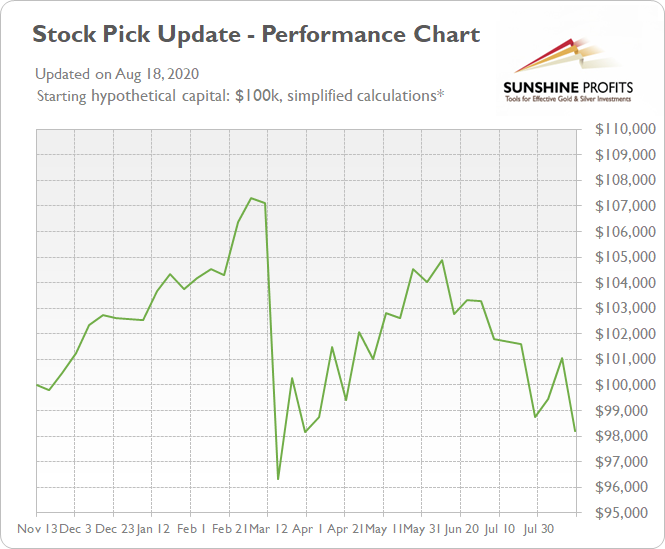
This means that our overall stock-picking performance can be summarized on the chart below. The assumptions are: starting with $100k, no leverage used. The data before Dec 24, 2019 comes from our internal tests and data after that can be verified by individual Stock Pick Updates posted on our website.
Below we include statistics and the details of our three recent updates:
- August 18, 2020
Long Picks (August 12 open - August 18 close % change): BA (-7.49%), SCHW (-1.55%), CXO (-4.91%), BXP (-5.58%), MSI (+5.14%)
Short Picks (August 12 open - August 18 close % change): CCI (+1.85%), AAPL (+4.58%), CHTR (+3.33%), ROP (+0.48%), SPGI (+3.65%)
Average long result: -2.88%, average short result: -2.78%
Total profit (average): -2.83% - August 11, 2020
Long Picks (August 5 open - August 11 close % change): V (+2.18%), WBA (+2.45%), ECL (+3.13%), XOM (+1.86%), PSA (-1.38%)
Short Picks (August 5 open - August 11 close % change): COP (+3.14%), CCI (-2.75%), SPGI (-0.95%), PYPL (-5.01%), K (-2.35%)
Average long result: +1.65%, average short result: +1.59%
Total profit (average): +1.62% - August 4, 2020
Long Picks (July 29 open - August 4 close % change): IFF (-2.27%), WBA (+0.24%), ED (-0.50%), XOM (-0.55%), WU (+7.13%)
Short Picks (July 29 open - August 4 close % change): HES (+1.34%), XLNX (+2.30%), SPGI (-0.71%), APD (-3.33%), KO (-3.01%)
Average long result: +0.81%, average short result: +0.68%
Total profit (average): +0.75%
Let's check which stocks could magnify S&P's gains in case it rallies, and which stocks would be likely to decline the most if S&P plunges. Here are our stock picks for the Wednesday, August 19 - Tuesday, August 25 period.
We will assume the following: the stocks will be bought or sold short on the opening of today's trading session (August 19) and sold or bought back on the closing of the next Tuesday's trading session (August 25).
We will provide stock trading ideas based on our in-depth technical and fundamental analysis, but since the main point of this publication is to provide the top 5 long and top 5 short candidates (our opinion, not an investment advice) for this week, we will focus solely on the technicals. The latter are simply more useful in case of short-term trades.
First, we will take a look at the recent performance by sector. It may show us which sector is likely to perform best in the near future and which sector is likely to lag. Then, we will select our buy and sell stock picks.
There are eleven stock market sectors: Energy, Materials, Industrials, Consumer Discretionary, Consumer Staples, Health Care, Financials, Technology, Communications Services, Utilities and Real Estate. They are further divided into industries, but we will just stick with these main sectors of the stock market.
We will analyze them and their relative performance by looking at the Select Sector SPDR ETF's.
Let's start with our first charts (charts courtesy of www.stockcharts.com).
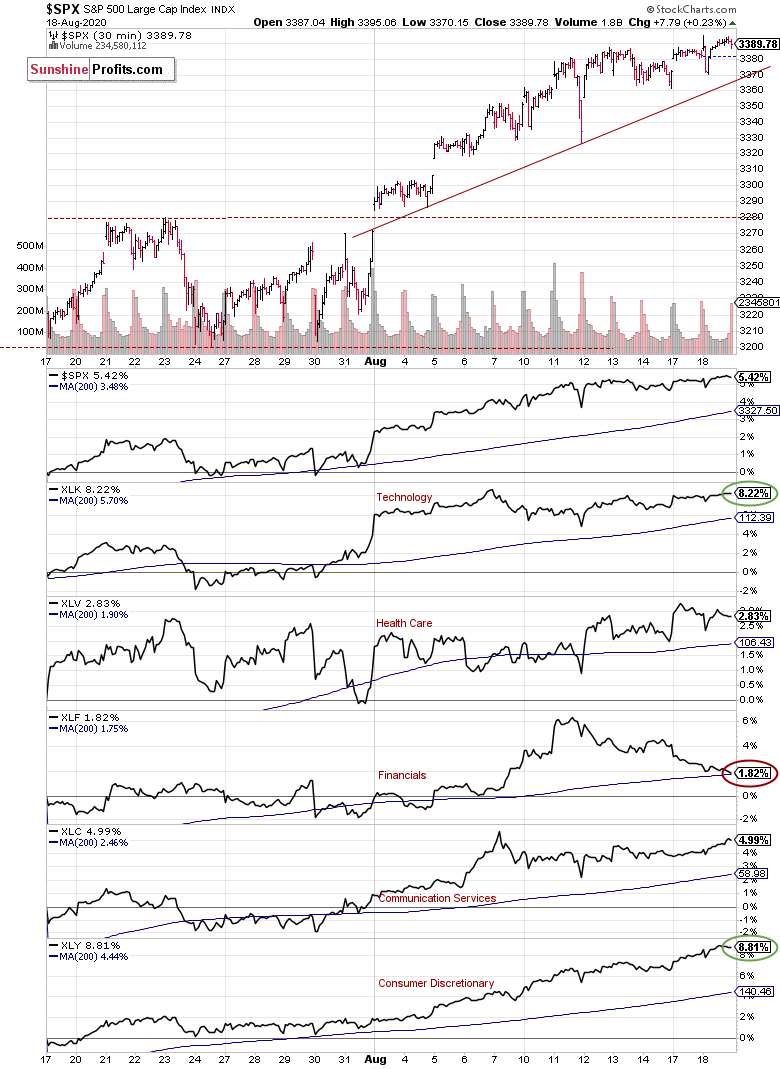
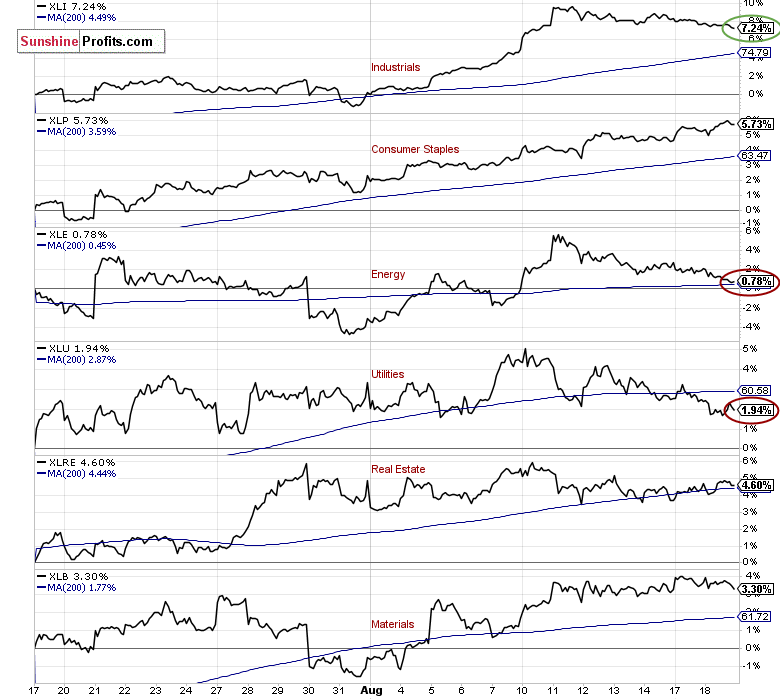
There's S&P 500's 30-minute chart along with market sector indicators for the past month. The S&P 500 index has gained 5.42% from the closing price on July 16. The strongest sector was Consumer Discretionary XLY, as it gained 8.81%. The Technology XLK gained 8.22% and Industrials XLI gained 7.24%.
On the other hand, the weakest sector was Energy XLE, as it gained just 0.78% in a month. The Financials XLF gained 1.82% and Utilities XLU gained 1.94%.
Based on the above, we decided to choose our stock picks for the next week. We will choose our top 3 long and top 3 short candidates using trend-following approach, and top 2 long and top 2 short candidates using contrarian approach:
Trend-following approach:
- buys: 1 x Consumer Discretionary, 1 x Technology, 1 x Industrials
- sells: 1 x Energy, 1 x Financials, 1 x Utilities
Contrarian approach (betting against the recent trend):
- buys: 1 x Energy, 1 x Financials
- sells: 1 x Consumer Discretionary, 1 x Technology
Trend-following approach
Top 3 Buy Candidates
VFC VFCorp - Consumer Discretionary
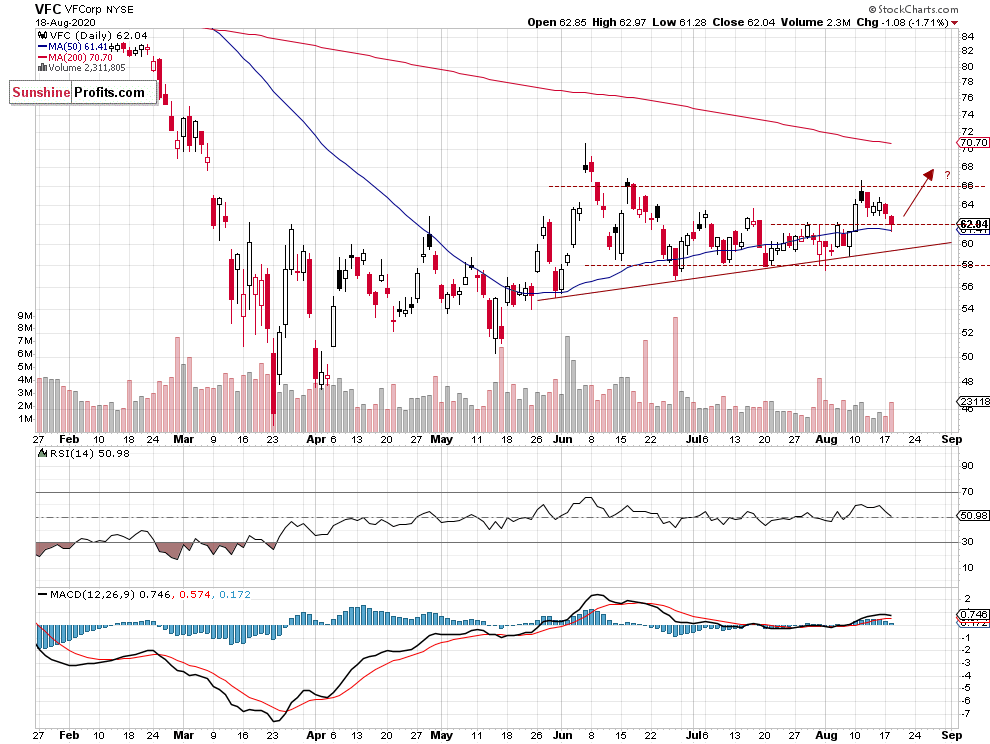
- Possible uptrend continuation after breaking above $62 in the first half of the month
- The next resistance level of $66
- Stock continues to trade above medium-term upward trend line
IBM International Business Machines - Technology
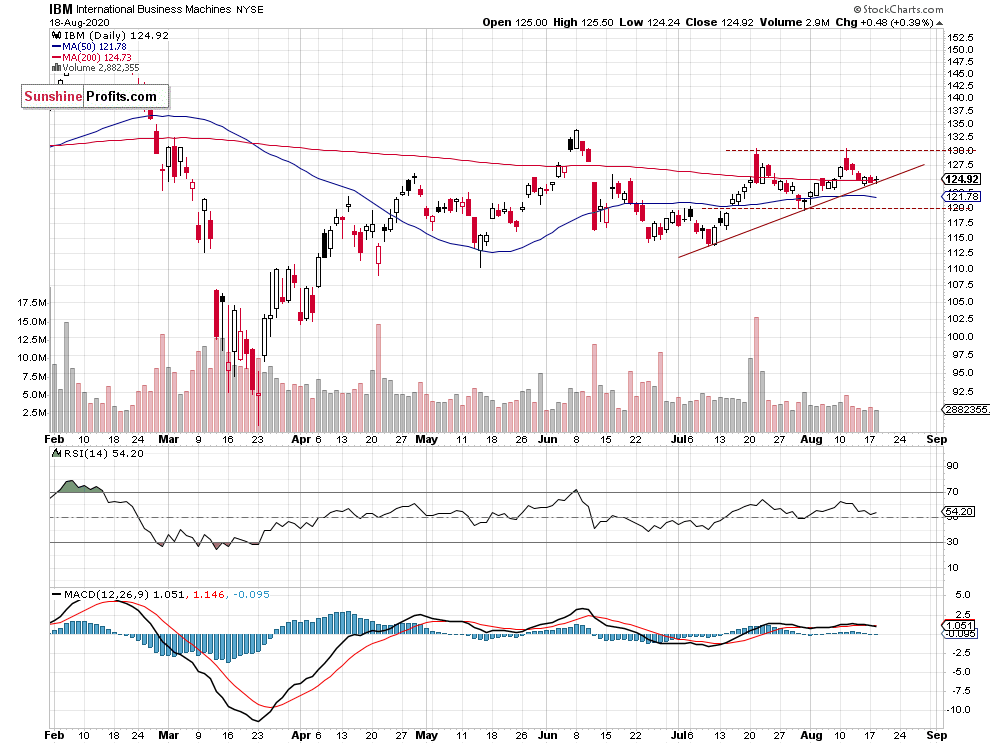
- Stock remains above two-month-long upward trend line
- Possible uptrend continuation
- The resistance level of $130 (short-term upside profit target)
- The support level is at $120
CAT Caterpillar, Inc. - Industrials
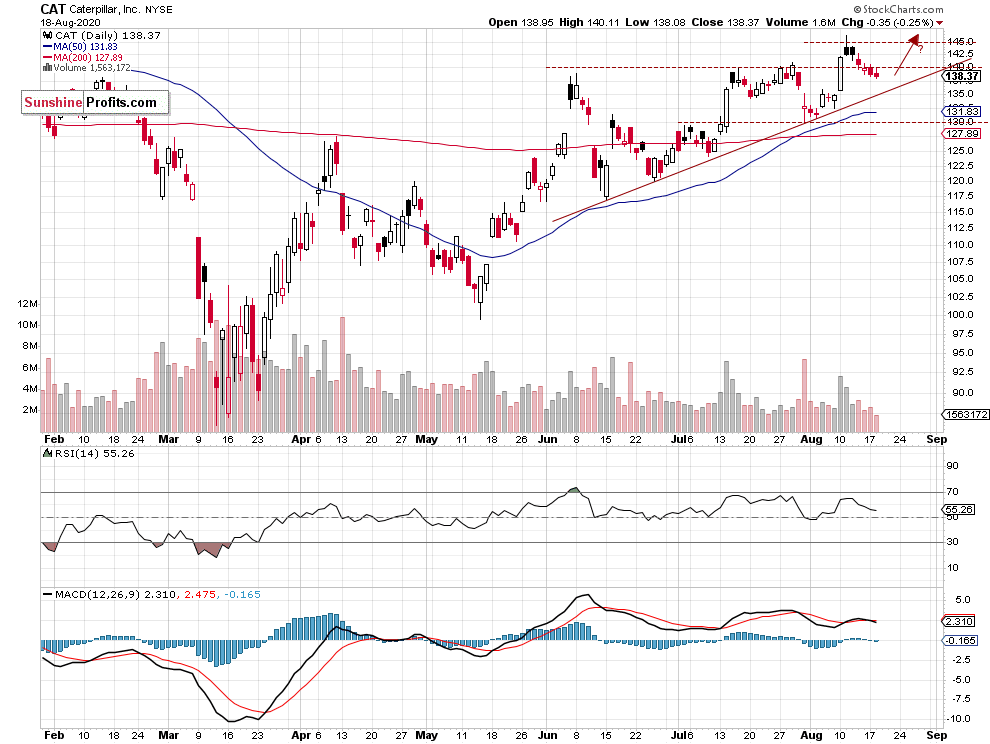
- Stock remains above its medium-term upward trend line
- The resistance level and upside profit target level is at $145
Top 3 Sell Candidates
WMB Williams Cos., Inc. - Energy
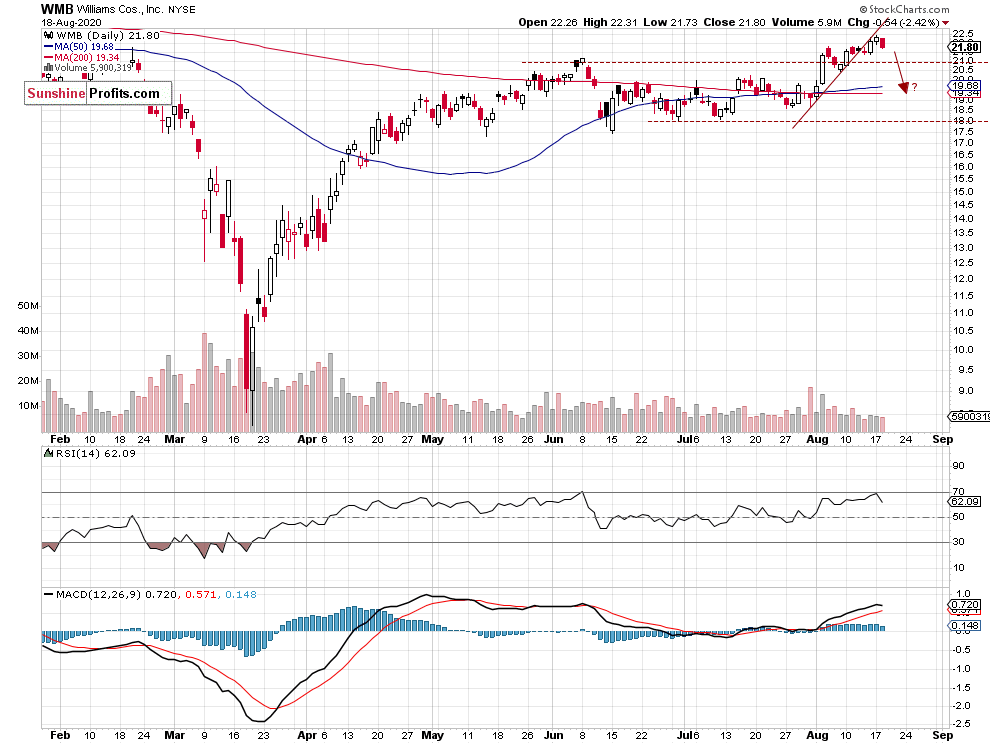
- The price broke below short-term upward trend line, possible medium-term downward reversal pattern
- The resistance level is at $22.0-22.5
- The support level is at $18-19 (short-term downside profit target level)
TROW T. Rowe Price Associates, Inc. - Financials
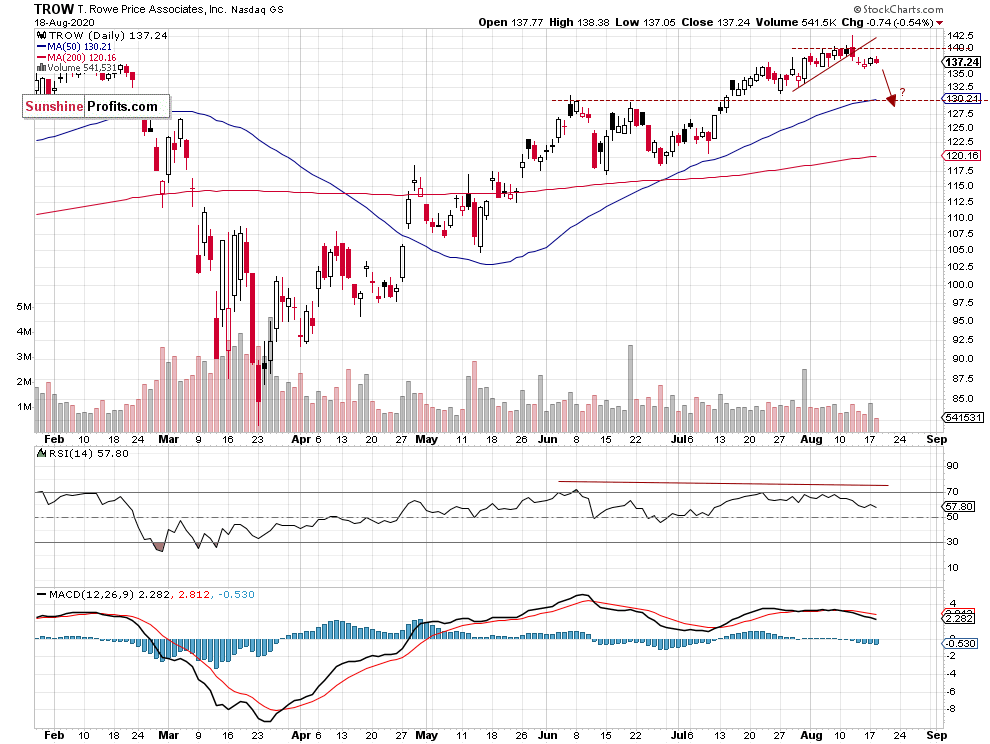
- Possible medium-term topping pattern
- Downward correction play
- The support level is at $130
XEL Xcel Energy - Utilities
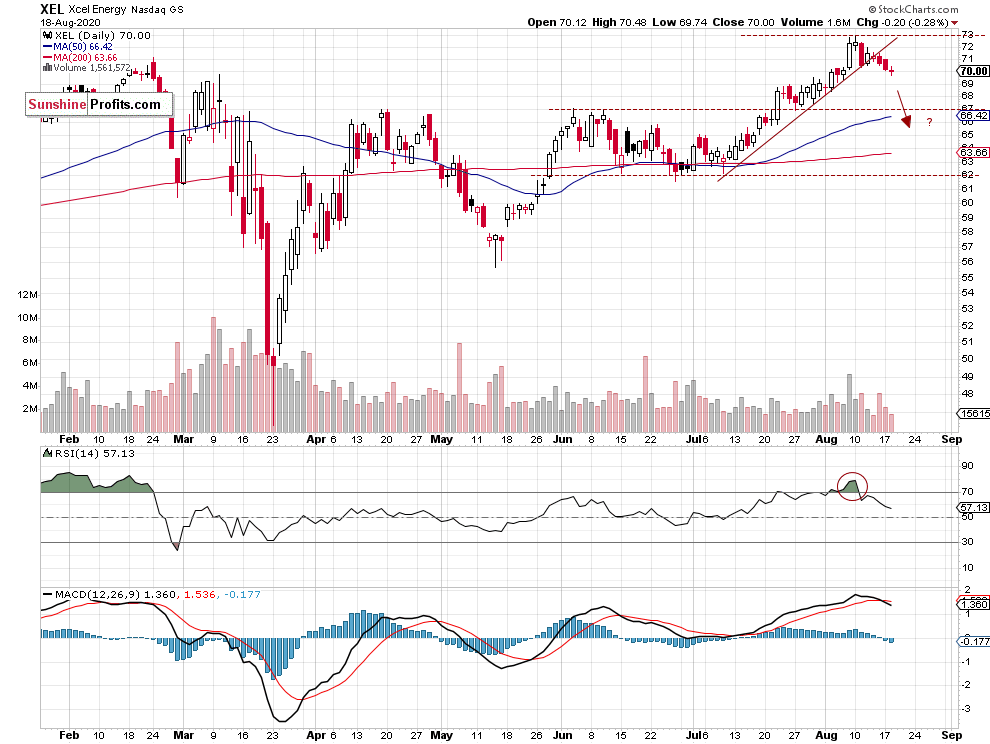
- Stock broke below its two-month-long upward trend line
- Possible medium-term topping pattern
- The support level is at $62-67 (short-term downside profit target level)
Contrarian approach
Top 2 Buy Candidates
CVX Chevron Corp. - Energy
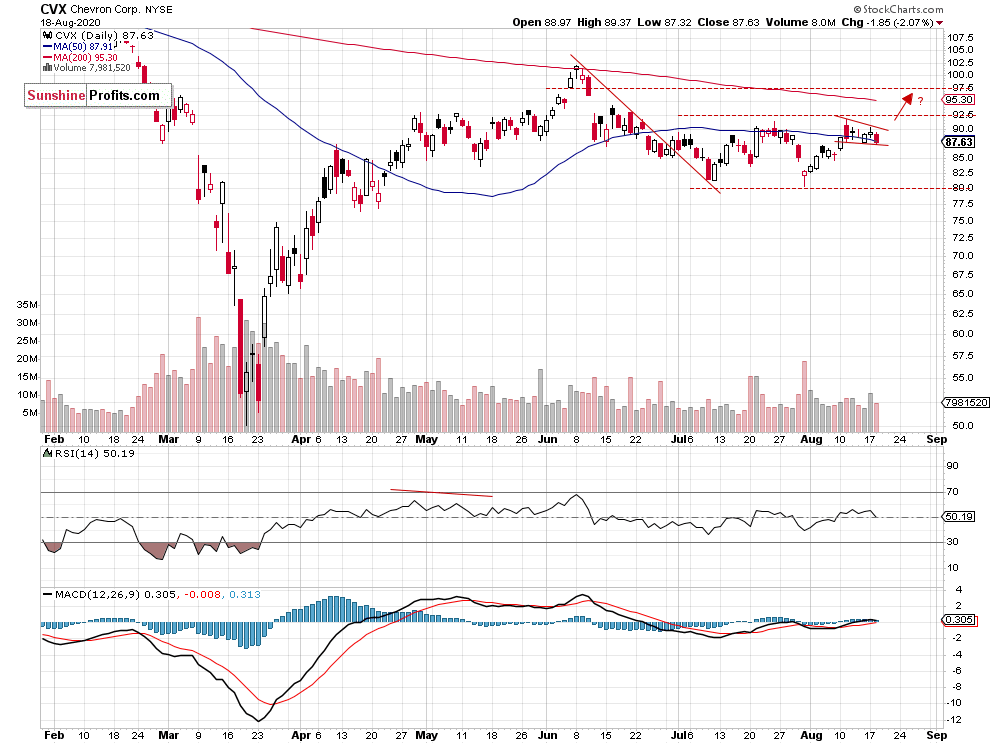
- Stock may resume uptrend after breaking above the bull flag pattern
- The resistance level of $97.5-100.0 - upside profit target level
- On the other hand, the support level is at $80
SCHW Charles Schwab Corp. - Financials
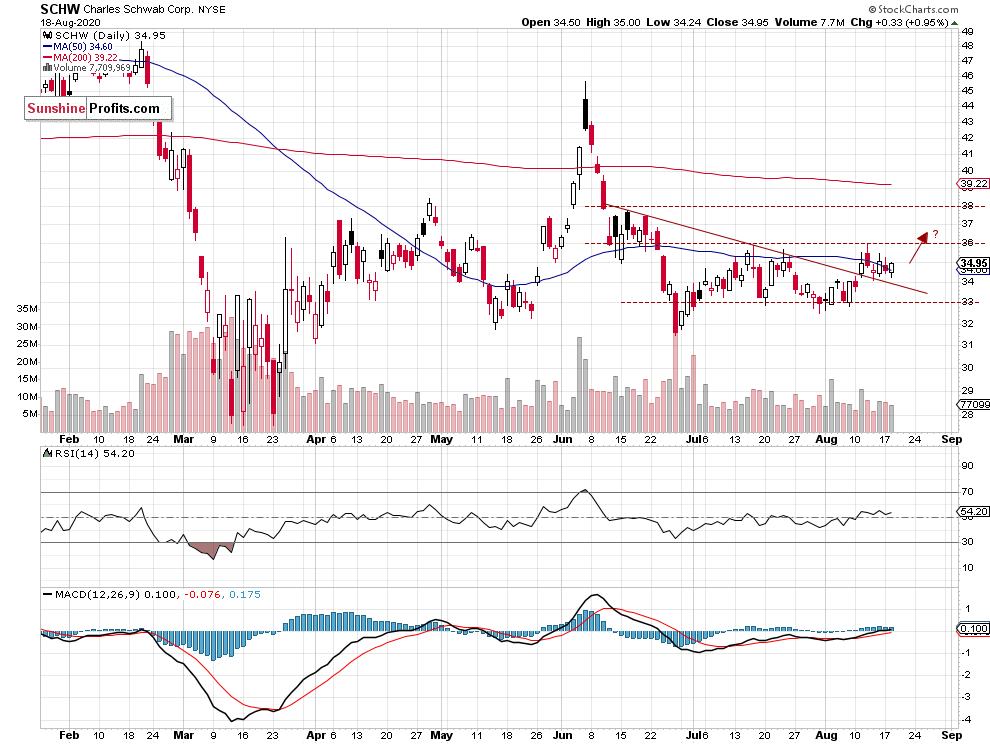
- Stock broke above its two-month-long downward trend line
- Upside profit target and the resistance level of $36-37
Top 2 Sell Candidates
HD Home Depot, Inc. - Consumer Discretionary
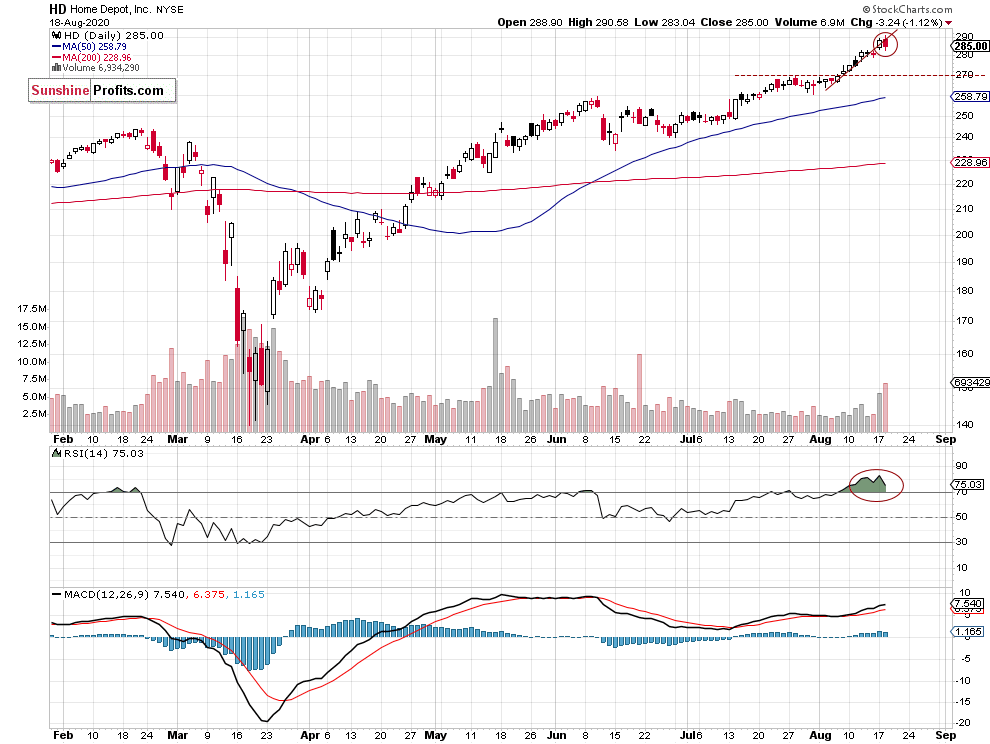
- Possible medium-term topping pattern
- Technical overbought conditions
- Downward correction play
- The support level is at $270 - short-term downside profit target level
AAPL Apple, Inc. - Technology
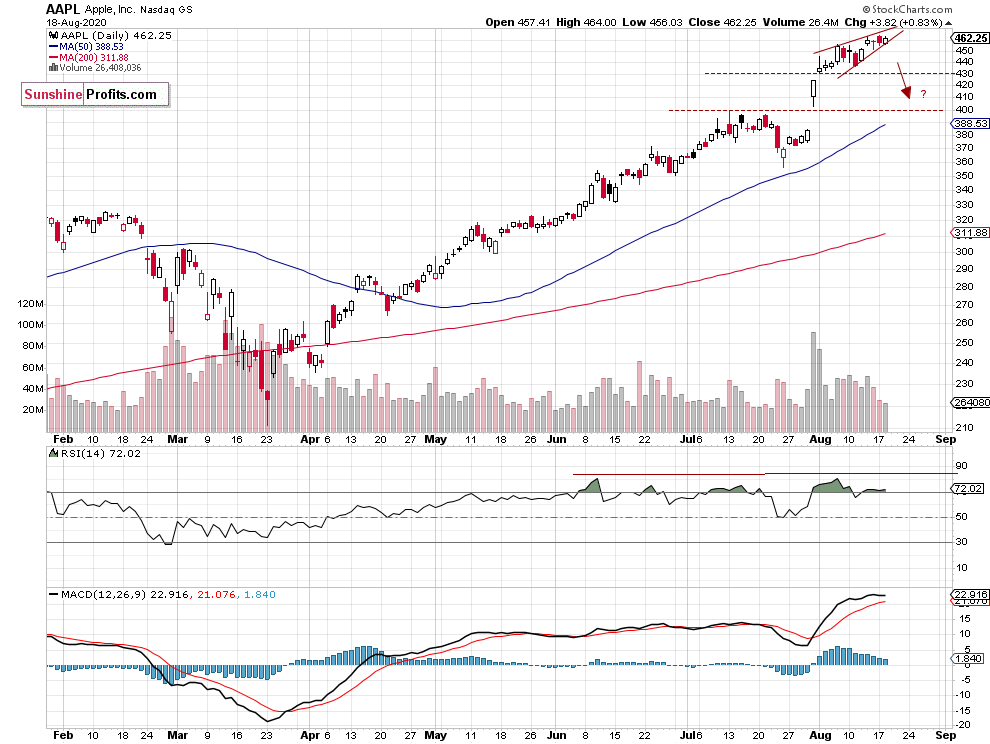
- Possible medium-term topping pattern - rising wedge
- Downward correction play
- The support level of $400-430 - downside profit target level
Conclusion
In our opinion, the following stock trades are justified from the risk/reward point of view between August 19 and August 25:
Long: VFC, IBM, CAT, CVX, SCHW
Short: WMB, TROW, XEL, HD, AAPL
Thank you.
Paul Rejczak
Stock Trading Strategist
Sunshine Profits - Effective Investments through Diligence and Care

