
tools spotlight
Stop-loss Details for Gold, Silver and Miners When Using SP Indicators
Once you’re familiar with our precious metals indicators, you might appreciate a more subtle point these indicators have to them. We have analyzed past performance of these indicators and tried to find a way to limit losses which would have occurred in the past. To do that, we decided to introduce a special mechanism to our indicators. Namely, we searched for a loss level at which you should have closed your positions. Such levels are called stop-loss levels. You can choose different levels, according to your own risk preferences. We searched for levels which would have given you relatively high rates of return.
In simple words, a stop-loss level works like that: you open a position based on signals from our indicators; if at any time while the position is open you lose more than X%, then you close your position. We looked for the level of X (stop-loss level) that would have given you relatively high returns. To do that, we considered various stop-loss levels and measured past performance under those levels. Results are presented in the charts below.
Just to make you familiar with the charts – the horizontal axis presents various stop-loss levels, where for instance 10% means that if losses exceed 10%, the position is closed. The vertical axis presents what would have been the overall rate of return between January 3, 2008 and October 18, 2012 for the given stop-loss level for positions taken solely based on a particular indicator.
SP Gold Bottom Indicator
All the tests have been done according to the suggestions on the use of each of our indicators as outlined in the sub-section on the performance of these indicators. For instance, the default suggestion for SP Gold Bottom indicator is to go long gold and silver for 3 weeks when a signal is flashed. This means that in our tests for this indicator we assumed that you open a long position for 3 weeks after which period the position is automatically closed. The stop-loss analysis is done within this time span.
All the results have been obtained assuming that no leverage was used. Returns with the use of leverage would have been even higher.
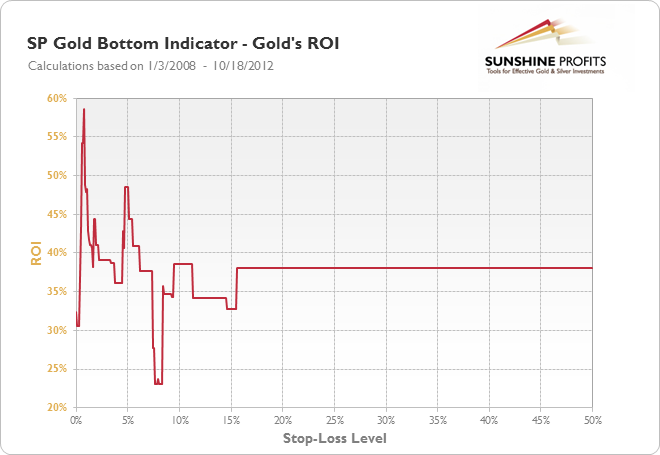
Our results suggest that the appropriate stop-loss level for the SP Gold Bottom Indicator when used for gold is 0.7% which level would have given you returns at 58.6%, compared to returns of 38.1% which would have been achieved without any stop-loss level. In the case of this particular indicator, we see that the returns are not stable relative to the stop-loss level – even a small change of the stop-loss level from 0.7% would have resulted in large differences in profits. However, as these differences would not bring profits below the level which would have been attained without any stop-loss levels (38.1%), the stop-loss level of 0.7% might be considered as one that might improve your overall returns.
In short, if one had traded gold according to the signals from the SP Gold Bottom Indicator and our suggestions (buying and holding the position for 3 weeks unless a 0.7% stop loss was reached), they would have gained 58.6% on their trades from the beginning of 2008 to October 18, 2012.
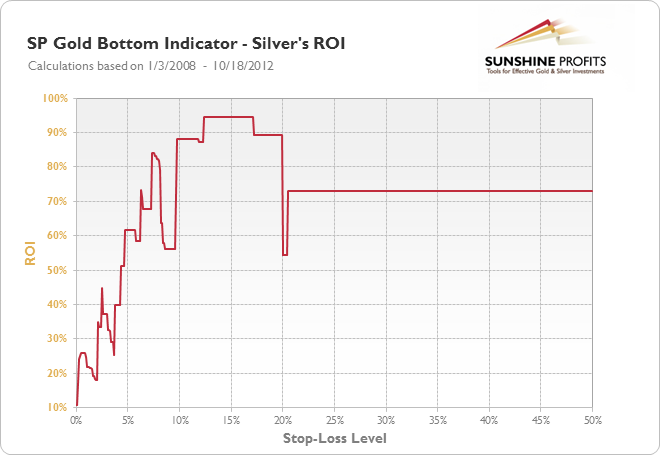
The case is quite different when the SP Gold Bottom Indicator is used for silver. Here, we see that highest returns could have been achieved for stop-loss levels between 12.4% and 17.1%. The results are relatively stable, since once we go out of these boundaries, returns don’t change decisively. Because of that, stop-loss levels in the range of 14.5% may be considered appropriate for the SP Gold Bottom Indicator when it is used for silver. One important finding is also that stop-loss levels below 7.5% might have considerably depressed your overall rate of return.
In short, if one had traded silver according to the signals from the SP Gold Bottom Indicator and our suggestions (buying and holding the position for 3 weeks unless a 14.5% stop loss was reached), they would have gained 94.6% on their trades from the beginning of 2008 to October 18, 2012.
SP Long-Term Gold Bottom Indicator
For the SP Long-Term Gold Bottom Indicator used for gold a stop-loss level of 3.2% would have given returns of 45.3%. These results are not particularly stable but this stop-loss level might be considered by more risk-inclined investors.
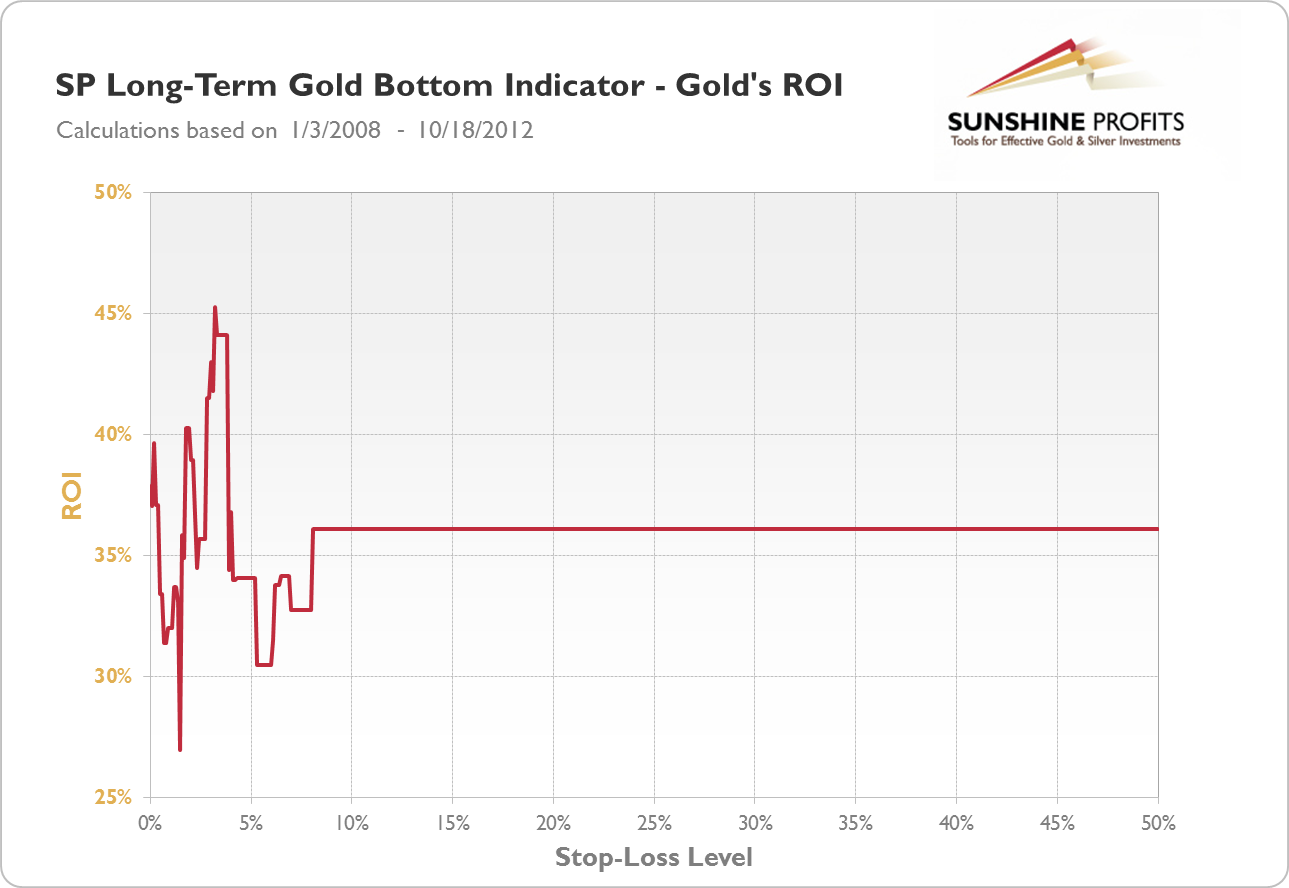
In short, if one had traded gold according to the signals from the SP Long-Term Gold Bottom Indicator and our suggestions (buying and holding the position for 2 weeks unless a 3.2% stop loss was reached), they would have gained 45.3% on their trades from the beginning of 2008 to October 18, 2012.
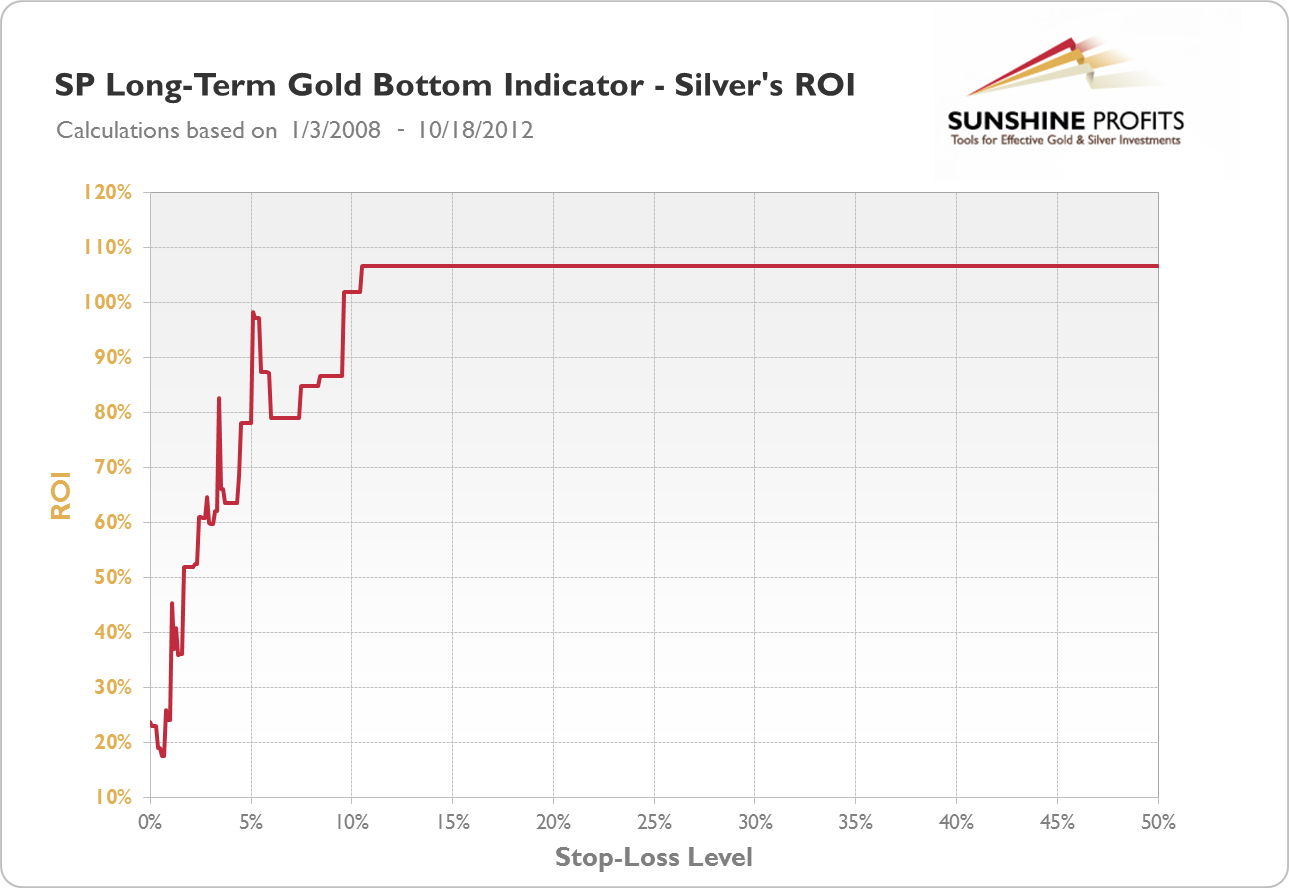
No stop-loss level would have improved returns from the same indicator used for silver. All in all, it seems that the results from using the SP Long-Term Gold Bottom Indicator are not improved by the use of stop-loss levels.
In short, if one had traded silver according to the signals from the SP Long-Term Gold Bottom Indicator and our suggestions (buying and holding the position for 2 weeks without any stop-loss level), they would have gained 106.8% on their trades from the beginning of 2008 to October 18, 2012.
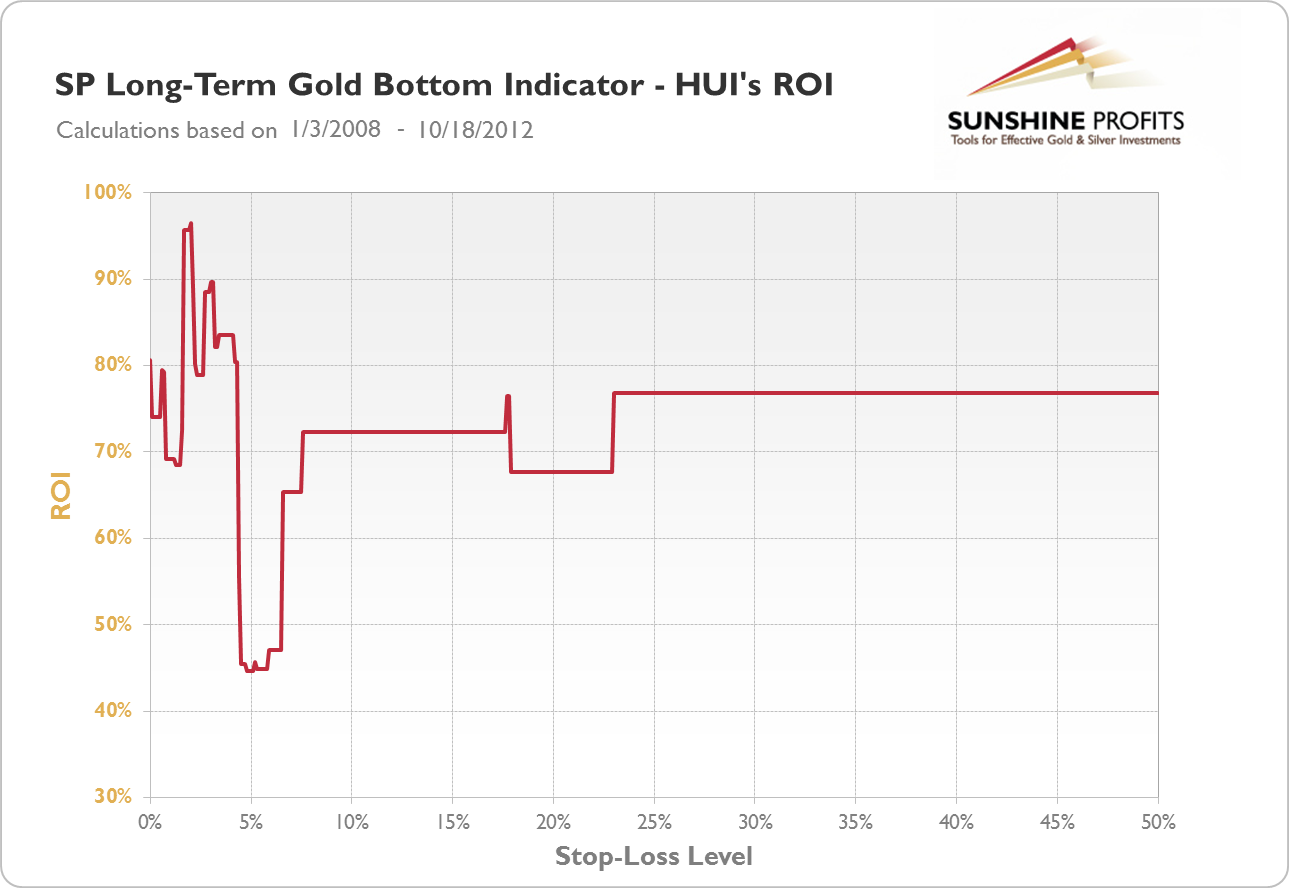
For the same indicator used for mining stocks a stop-loss level of 3.0% would have given returns of 89.7% compared to 76.8% which would have been achieved without stop-losses. Stop-losses between 4% and 23% should have been avoided as they would have depressed returns relative to the case when no stop-loss levels would have been used.
In short, if one had traded mining stocks according to the signals from the SP Long-Term Gold Bottom Indicator and our suggestions (buying and holding the position for 2 weeks unless a 3.0% stop loss was reached), they would have gained 89.7% on their trades from the beginning of 2008 to October 18, 2012.
SP Gold Stock Bottom Indicator
Stop-loss levels between 6.1% and 7.8% would have maximized the returns from the SP Gold Stock Bottom Indicator for gold. This stop-loss range is relatively stable with returns being depressed significantly only for stop-loss levels below 5%. It seems that the stop-loss level of 6.6% might have been appropriate for this indicator. Conversely, stop-loss levels below 5% don’t seem suitable. The use of appropriate stop-loss levels would have increased your rate of return from 77.8% to 102.6%.
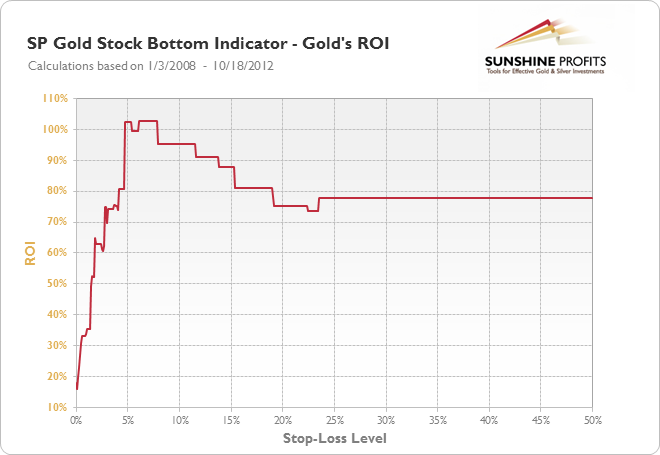
In short, if one had traded gold according to the signals from the SP Gold Stock Bottom Indicator and our suggestions (buying and holding the position for 4 weeks unless a 6.6% stop loss was reached), they would have gained 102.6% on their trades from the beginning of 2008 to October 18, 2012.
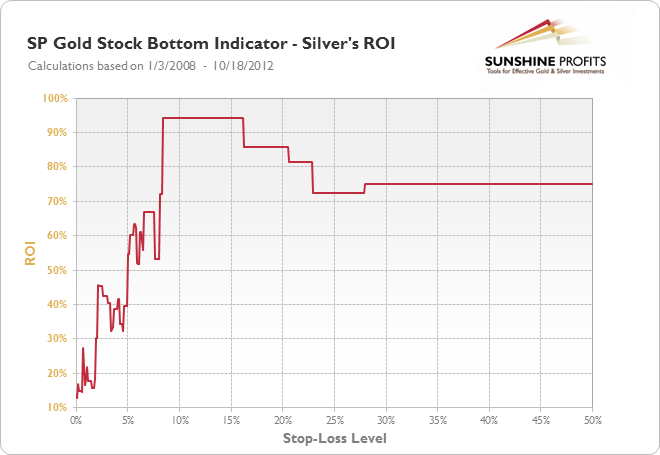
Returns for the same indicator used for silver are even more stable. With stop-loss levels between 8.4% and 16.1% the returns would have stood at 94.1% compared to 75.1% without stop-loss levels. A stop-loss level of 12.0% may be advisable. Stop-loss levels below 8% can significantly reduce returns from the indicator.
In short, if one had traded silver according to the signals from the SP Gold Stock Bottom Indicator and our suggestions (buying and holding the position for 4 weeks unless a 12.0% stop loss was reached), they would have gained 94.1% on their trades from the beginning of 2008 to October 18, 2012.
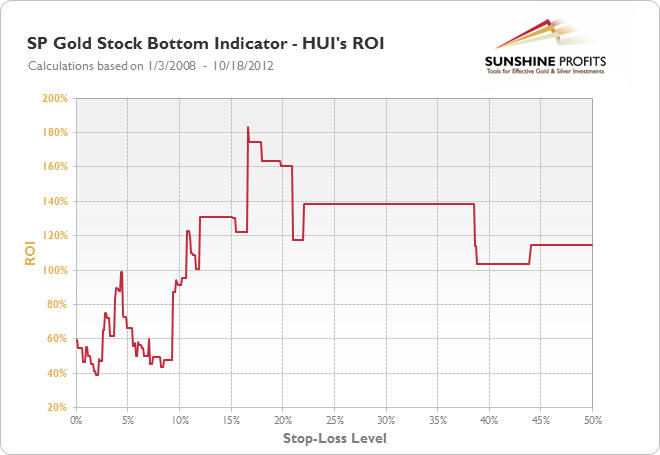
For the same indicator used for mining stocks, the stop-loss level of 17.5% would have given returns of 174.5%. This compares very favorably to returns without stop-loss levels which would have amounted to 114.7%. The results are not very stable with the decrease in the stop-loss level. Stop-losses below 16.6% significantly decrease the rate of return, and levels below 12% can result in returns being depressed compared to the use of the indicator without stop-loss levels.
In short, if one had traded mining stocks according to the signals from the SP Gold Stock Bottom Indicator and our suggestions (buying and holding the position for 4 weeks unless a 17.5% stop loss was reached), they would have gained 174.5% on their trades from the beginning of 2008 to October 18, 2012.
SP Long-Term Gold Stock Bottom Indicator
The SP Long-Term Gold Stock Bottom Indicator used for gold with the stop-loss level of 6.0% would have given you returns of 80.1%. This is significantly more than the returns of 58.0% which would have been achieved without stop-loss levels. These returns are more stable with the increase in the stop-loss level than with a decrease in it. It seems advisable to use a stop-loss level around 6.0% while levels below 5.0% may be inappropriate and depress the rate of return.
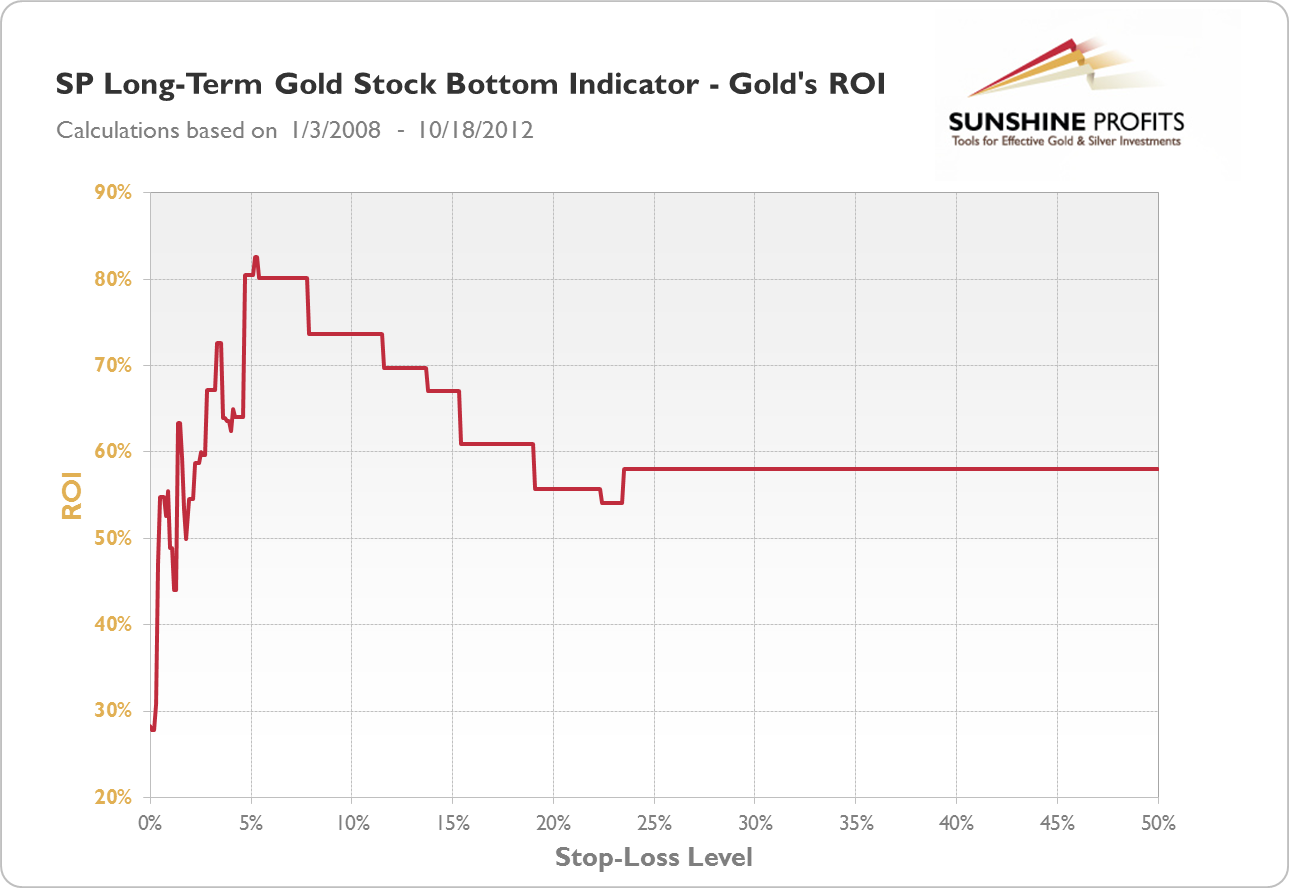
In short, if one had traded gold according to the signals from the SP Long-Term Gold Stock Bottom Indicator and our suggestions (buying and holding the position for 2 weeks unless a 6.0% stop loss was reached), they would have gained 80.1% on their trades from the beginning of 2008 to October 18, 2012.
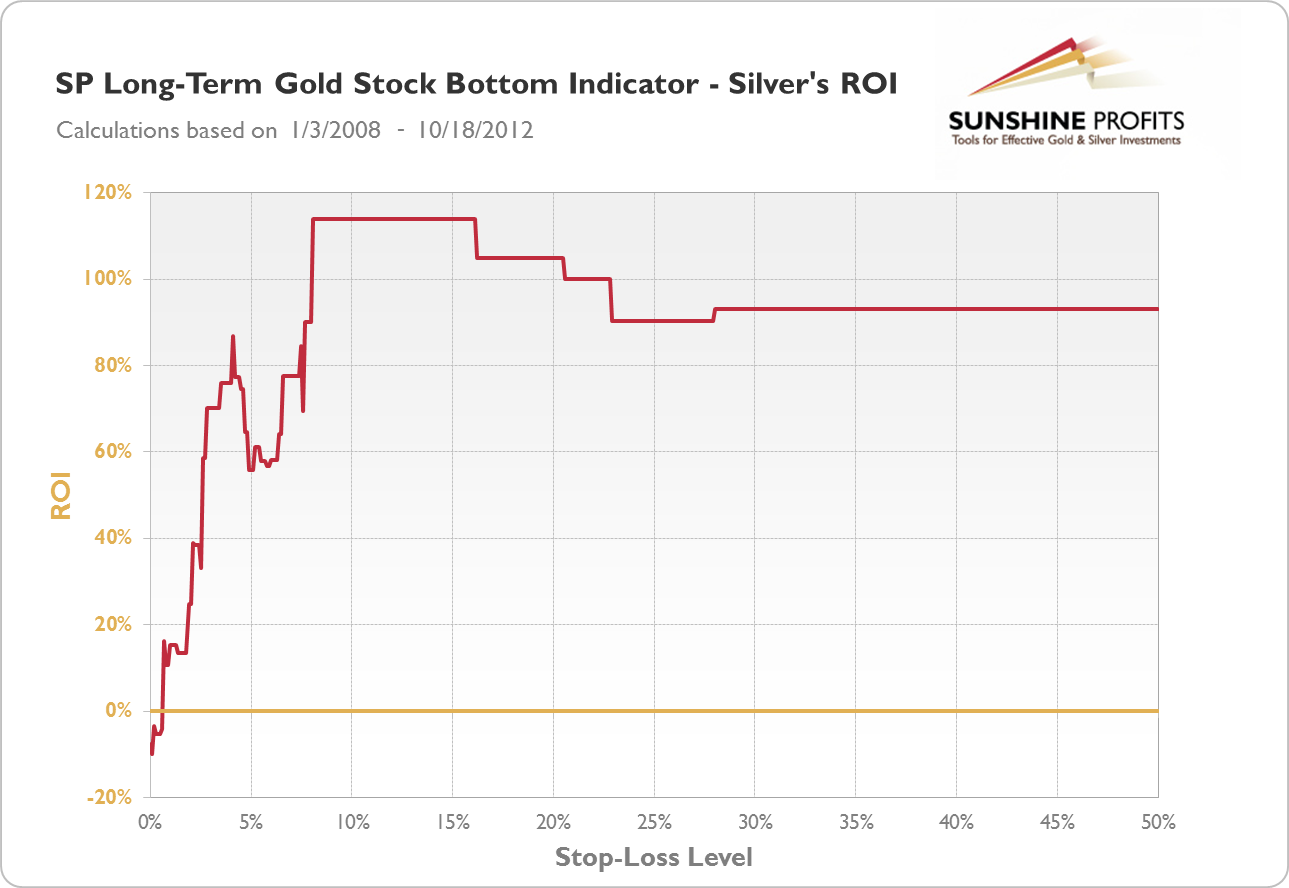
For the same indicator used for silver, stable results are achieved for stop-losses between 8.1% and 16.1%. A stop-loss level of 12.0% would have resulted in returns at 114.0%, an improvement compared to the 93.0% which would have been achieved without any stop-losses. Relatively low stop-loss levels, below 8.1% don’t seem advisable as they would have significantly depressed the rate of return.
In short, if one had traded silver according to the signals from the SP Long-Term Gold Stock Bottom Indicator and our suggestions (buying and holding the position for 2 weeks unless a 12.0% stop loss was reached), they would have gained 114.0% on their trades from the beginning of 2008 to October 18, 2012.
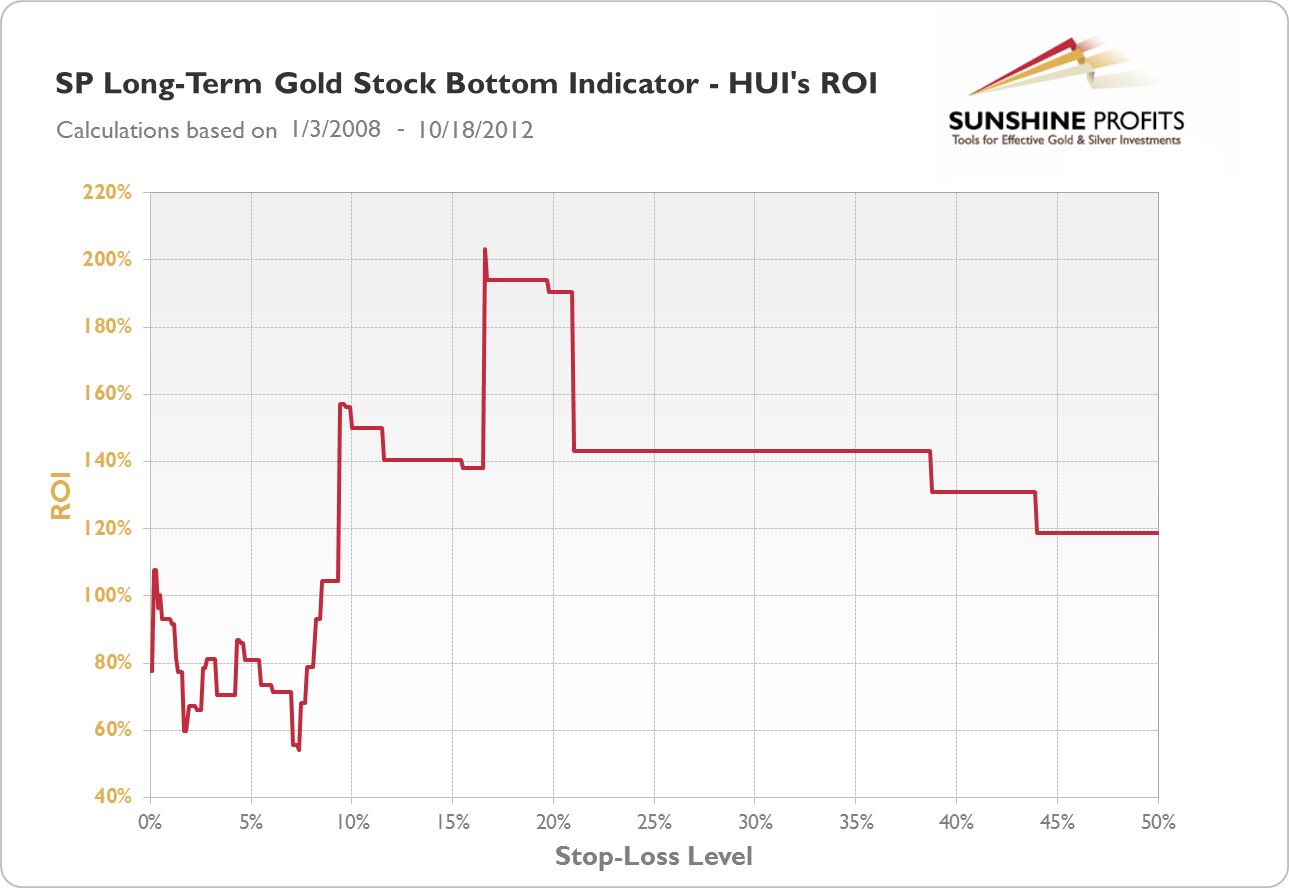
Based on past data, a stop-loss level of 18.2% might be advisable for the SP Long-Term Gold Stock Bottom Indicator when used for mining stocks. Stop-losses below 16.6% would have given returns lower than those without stop-losses. The difference in returns for a stop-loss at 18.2% (returns at 194.0%) and for no stop-loss used (returns at 118.9%) seems to make the use of stop-losses advisable.
In short, if one had traded mining stocks according to the signals from the SP Long-Term Gold Stock Bottom Indicator and our suggestions (buying and holding the position for 2 weeks unless a 18.2% stop loss was reached), they would have gained 194.0% on their trades from the beginning of 2008 to October 18, 2012.
SP Short-Term Gold Stock Bottom Indicator
The results for the SP Short-Term Gold Stock Bottom Indicator for mining stocks are quite different from those for the hitherto considered indicators. Namely, it seems that imposing stop-loss levels on this indicator doesn’t improve the rate of return. Because of that, using stop-loss levels for this indicator may not be advisable.
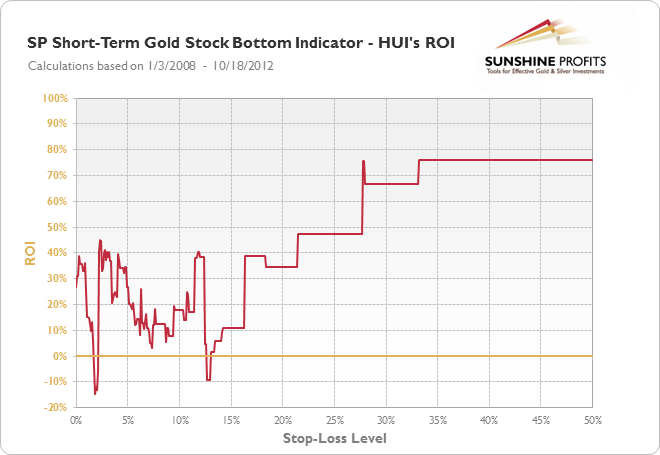
In short, if one had traded mining stocks according to the signals from the SP Short-Term Gold Stock Bottom Indicator and our suggestions (buying and holding the position for 2 weeks without any stop-loss level), they would have gained 75.9% on their trades from the beginning of 2008 to October 18, 2012.
SP Gold Stock Extreme Indicator
For the SP Gold Stock Extreme Indicator used for gold, the most appropriate stop-loss seems to be at 10.3% with returns at 111.0% compared to 92.1% which would have been achieved without the use of stop-losses. These results are relatively stable but returns fall steeper with the decrease in the stop-loss level. Particularly, stop-loss level below 5% could have resulted in returns lower than for the use of the indicator without stop-losses.
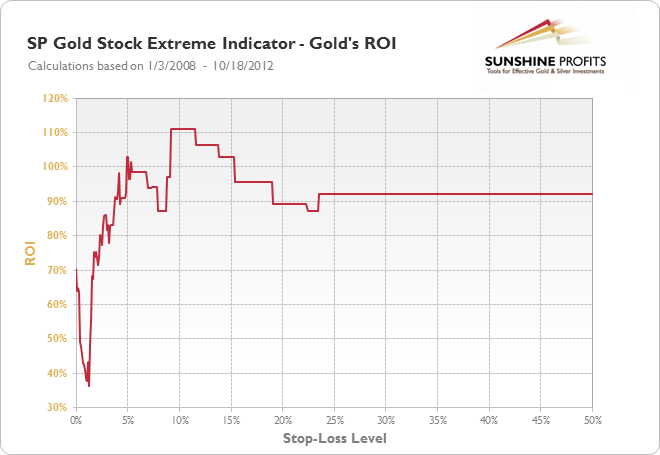
In short, if one had traded gold according to the signals from the SP Gold Stock Extreme Indicator and our suggestions (buying and holding the position for 2 weeks unless a 10.3% stop loss was reached), they would have gained 111.0% on their trades from the beginning of 2008 to October 18, 2012.
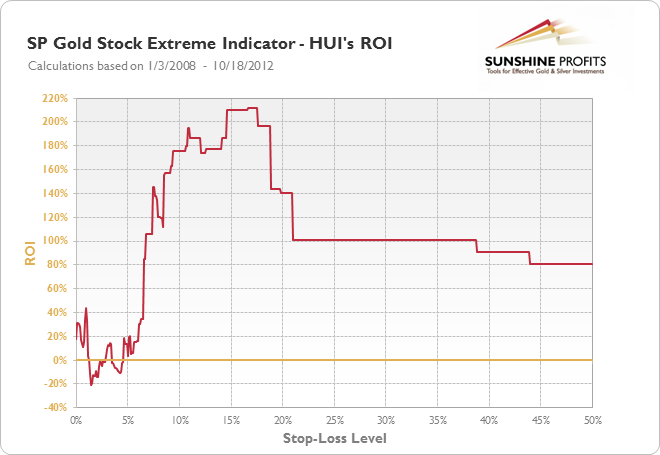
The appropriate use of stop-losses seems to be critical for the SP Gold Stock Extreme Indicator when it is used for mining stocks as the difference between the use of stop-losses at 15.6% (returns equal to 210.2%) and the use of the indicator without stop-losses (returns at 81.1%) is considerably pronounced. These results are considerably stable and only stop-losses lower than 6.6% would have given returns lower than returns without stop-losses. It is worth noting, however, that setting the stop-loss at 6.5% would have depressed the rate of return to only 34.2%.
In short, if one had traded mining stocks according to the signals from the SP Gold Stock Extreme Indicator and our suggestions (buying and holding the position for 2 weeks unless a 15.6% stop loss was reached), they would have gained 210.2% on their trades from the beginning of 2008 to October 18, 2012.
SP Gold Stock Extreme Indicator #2
Results for stop-loss levels for the SP Gold Stock Extreme Indicator #2 are consistent for gold, silver and mining stocks. It seems that no reasonable stop-loss level is advisable for any of the assets. This might suggest that the SP Gold Stock Extreme Indicator #2 performs best without any stop-loss levels imposed on it.
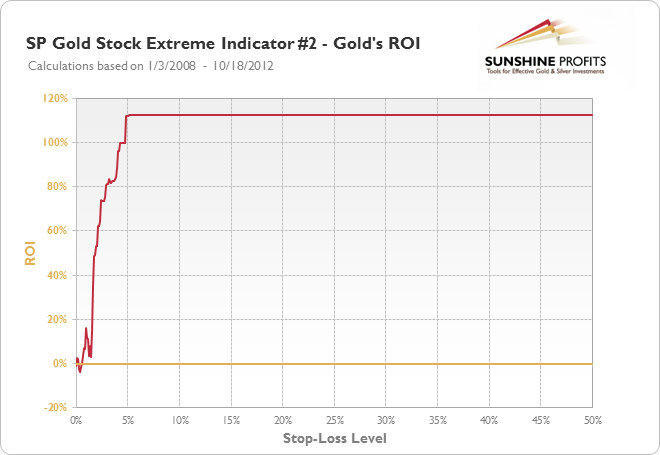
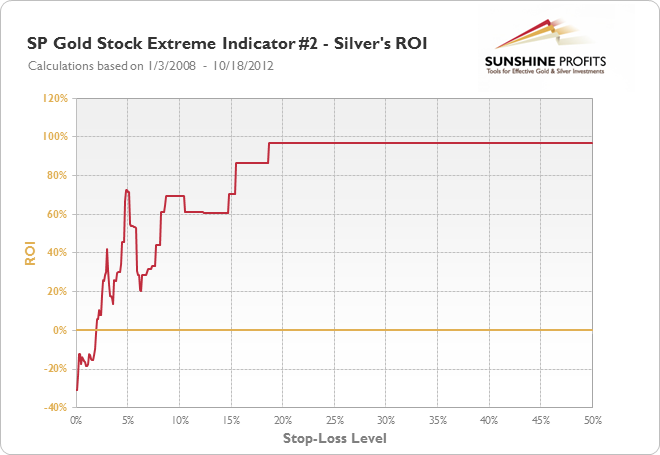
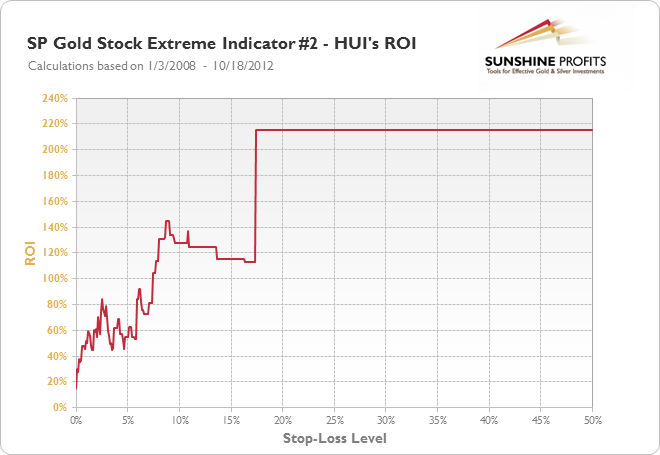
In short, if one had traded gold, silver or mining stocks according to the signals from the SP Gold Stock Extreme Indicator #2 and our suggestions (buying and holding the position for 2 weeks without any stop-loss level), they would have gained 112.6%, 96.7% or 215.1%, respectively, on their trades from the beginning of 2008 to October 18, 2012.
A summary of the main findings of our analysis is presented in the table below. The first column specifies the analyzed indicator; the second specifies the asset the indicator is used for (gold, silver, mining stocks); the third gives you the suggested action when the indicator flashes a signal; the forth one presents the suggested stop-loss level.
| Indicator | Used for | Suggested action | Stop-loss |
|---|---|---|---|
| SP Gold Bottom Indicator | Gold | Go long for 3 weeks | 0.7% |
| SP Gold Bottom Indicator | Silver | Go long for 3 weeks | 14.5% |
| SP Long-Term Gold Bottom Indicator | Gold | Go long for 2 weeks | 3.2% |
| SP Long-Term Gold Bottom Indicator | Silver | Go long for 2 weeks | none |
| SP Long-Term Gold Bottom Indicator | Mining stocks | Go long for 2 weeks | 3.0% |
| SP Gold Stock Bottom Indicator | Gold | Go long for 4 weeks | 6.6% |
| SP Gold Stock Bottom Indicator | Gold | Go long for 4 weeks | 12.0% |
| SP Gold Stock Bottom Indicator | Gold | Go long for 4 weeks | 17.5% |
| SP Long-term Gold Stock Bottom Indicator | Gold | Go long for 2 weeks | 6.0% |
| SP Long-term Gold Stock Bottom Indicator | Silver | Go long for 2 weeks | 12.0% |
| SP Long-term Gold Stock Bottom Indicator | Mining stocks | Go long for 2 weeks | 18.2% |
| SP Short-term Gold Stock Bottom Indicator | Mining stocks | Go long for 2 weeks | none |
| SP Gold Stock Extreme Indicator | Gold | Go long for 2 weeks | 10.3% |
| SP Gold Stock Extreme Indicator | Mining stocks | Go long for 2 weeks | 15.6% |
| SP Gold Stock Extreme Indicator #2 | Gold | Go long for 2 weeks | none |
| SP Gold Stock Extreme Indicator #2 | Silver | Go long for 2 weeks | none |
| SP Gold Stock Extreme Indicator #2 | Mining stocks | Go long for 2 weeks | none |

Dear Sunshine Profits,


