

Trading position (short-term; our opinion): Short positions (with a stop-loss order at $52.52 and the initial downside target at $45.80) are justified from the risk/reward perspective.
On Friday, crude oil gained 0.47% supported by Saudi energy minister commentary who said that Saudi Arabia did not rule out the possibility of additional production cuts. Thanks to these circumstances, light crude invalidated the earlier breakdown under the lower border of the consolidation, but is this event as bullish as it look at the first sight?
Crude Oil’s Technical Picture
Let’s take a closer look at the charts and find out (charts courtesy of http://stockcharts.com).
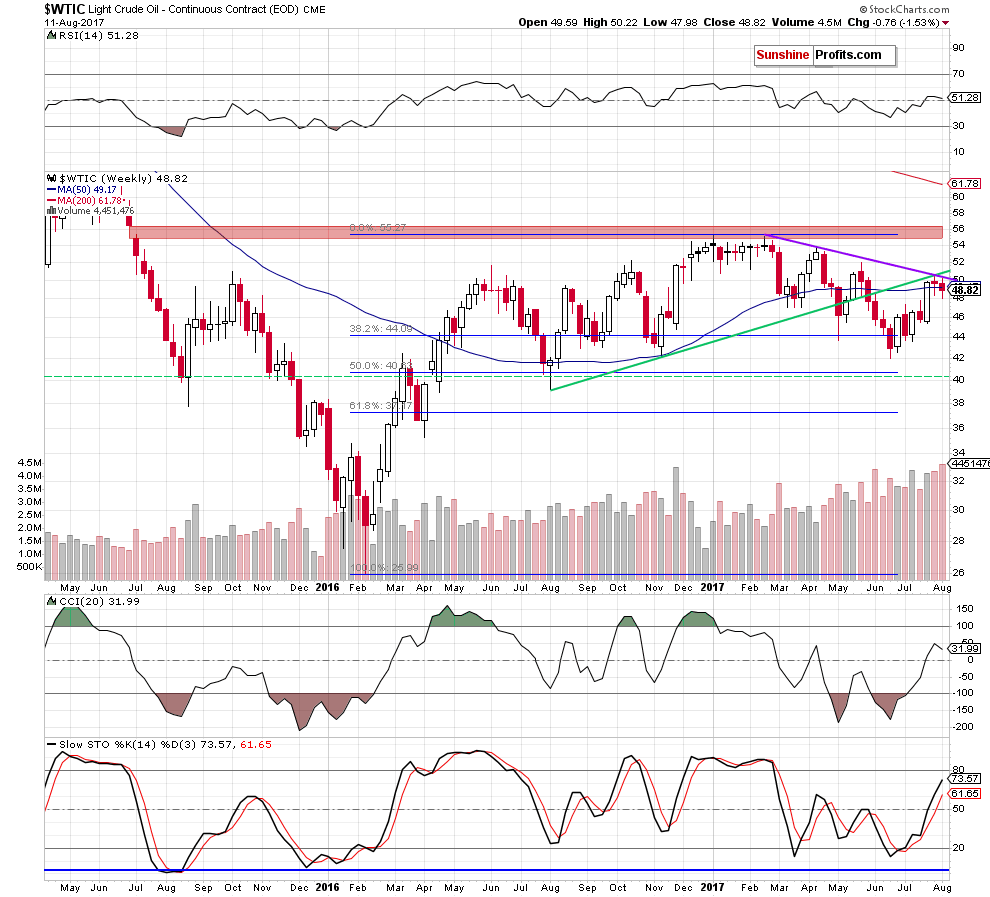
On the above chart, we see that the medium-term green line and the purple declining resistance line continued to keep gains in check in the previous week. Additionally, crude oil closed the week under the previously-broken 50-week moving average, which together with the size of volume, which accompanied last week’s decline suggests that further deterioration is just around the corner.
Will the very short-term chart give us more bearish clues? Let’s check.
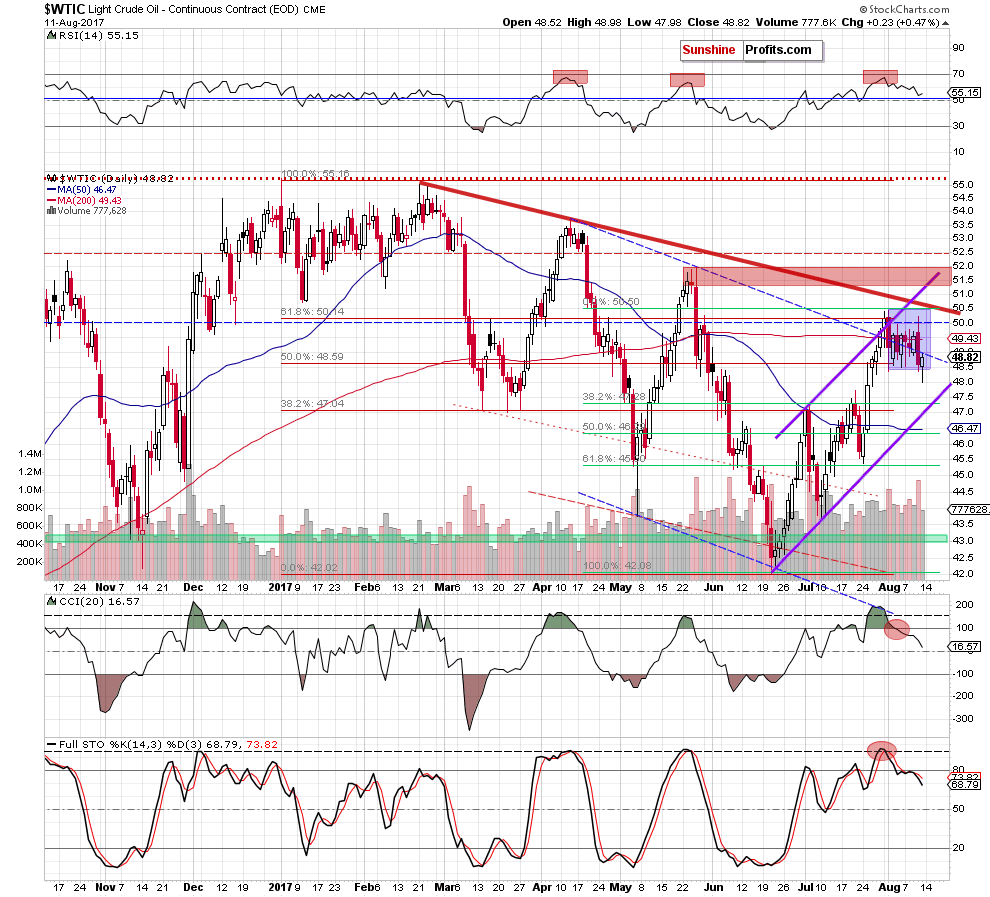
Looking at the daily chart, we see that crude oil moved lower after the market’s open, which pushed the price below the lower border of the consolidation. Despite this deterioration oil bulls stopped declines and triggered a rebound, which took light crude oil into the consolidation. In this way the commodity invalidated the earlier breakdown, which is a positive development.
But is this as bullish as it seems at the first sight? In our opinion, it’s not. Why? Firstly, despite Friday’s move light crude remains under the resistance area created by the 61.8% Fibonacci retracement (based on the entire 2017 downward move), the barrier of $5, the 200-day moving average and the upper border of the purple rising trend channel. Secondly, the sell signals generated by the daily indicators are still in cards, supporting oil bears and lower prices of crude oil. Thirdly, Friday’s increase materialized on smaller volume than earlier declines, which suggests that oil bulls are not as strong as it seems.
All the above suggests that further deterioration is just around the corner and what we wrote a week ago remains up-to date also today:
(…) crude oil remains in the blue consolidation under the resistance area created by the 61.8% Fibonacci retracement (based on the entire 2017 downward move), the barrier of $50 and the upper border of the purple rising trend channel. What does it mean for black gold?
Taking into account an invalidation of the breakout above these resistance levels and its potential negative impact on the price, the sell signals generated by the daily indicators (…) we believe that oil bears have many important reasons to act, which should result in further deterioration in the coming days – especially when we factor in the medium-term picture (…).
How low could the commodity go?
If light crude moves lower from current levels, the first downside target will be the last week low, which creates the lower border of the blue consolidation (at $48.37). If it is broken, the next downside target for bears will be around $47.25, where the 38.2% Fibonacci retracement based on the entire recent upward move is. However, taking into account all negative above-mentioned factors, we think that light crude will move even lower and test the lower border of the purple rising trend channel in the coming days (currently around $46.30). Please note that this area is also reinforced by the 50% Fibonacci retracement, which could pause for a bit further declines.
Summing up, short (already profitable) positions continue to be justified from the risk/reward perspective as crude oil remains under the abovementioned strong resistance zone. Additionally, Friday’s increase materialized on smaller volume than earlier declines, which suggests further deterioration in the coming days.
Very short-term outlook: bearish
Short-term outlook: mixed with bearish bias
MT outlook: mixed
LT outlook: mixed
Trading position (short-term; our opinion): Short (already profitable) positions (with a stop-loss order at $52.52 and the initial downside target at $45.80) are justified from the risk/reward perspective. We will keep you – our subscribers – informed should anything change.
As a reminder – “initial target price” means exactly that – an “initial” one, it’s not a price level at which we suggest closing positions. If this becomes the case (like it did in the previous trade) we will refer to these levels as levels of exit orders (exactly as we’ve done previously). Stop-loss levels, however, are naturally not “initial”, but something that, in our opinion, might be entered as an order.
Thank you.
Nadia Simmons
Forex & Oil Trading Strategist
Przemyslaw Radomski, CFA
Founder, Editor-in-chief, Gold & Silver Fund Manager
Gold & Silver Trading Alerts
Forex Trading Alerts
Oil Investment Updates
Oil Trading Alerts

