

Trading position (short-term; our opinion): Short positions (with a stop-loss order at $52.52 and the initial downside target at $45.80) are justified from the risk/reward perspective.
On Monday, the black gold moved higher as news of an OPEC and non-OPEC members meeting at the beginning of next week supported the price. Thank to these circumstances, light crude oil climbed above the resistance lines and the barrier of $50. Will oil bulls hold the price above them in the coming week?
Crude Oil’s Technical Picture
Let’s take a closer look at the charts and find out (charts courtesy of http://stockcharts.com).
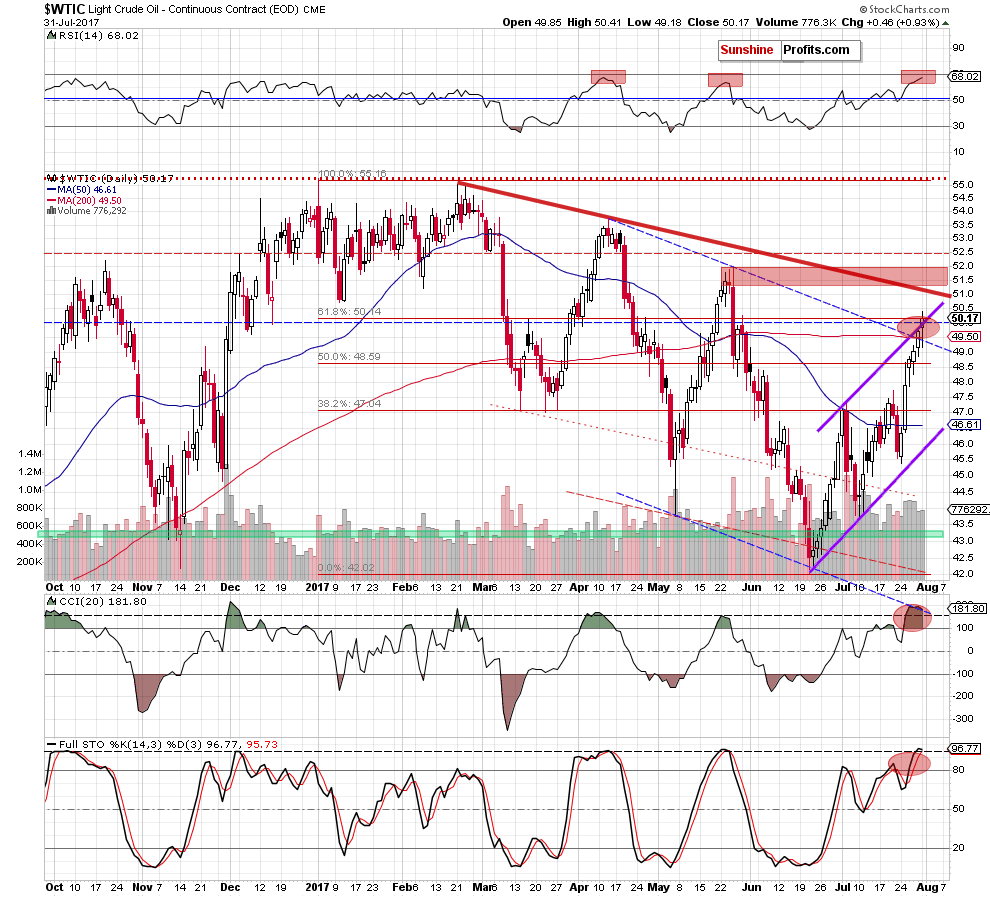
The first thing that catches the eye on the daily chart is a breakout above the barrier of $50 and the upper border of the purple rising trend channel. Thanks to yesterday’s increase the commodity also tested the 61.8% Fibonacci retracement based on the entire 2017 downward move. Despite this improvement, light crude closed yesterday’s session under the abovementioned retracement, which means an invalidation of the earlier small breakout. Additionally, Monday’s increase didn’t materialize on significant volume, which increases the probability of reversal in the very near future.
On top of that, the black gold increased to one more important resistance. Which one? Let’s zoom out our picture and take a closer look at the medium-term chart.
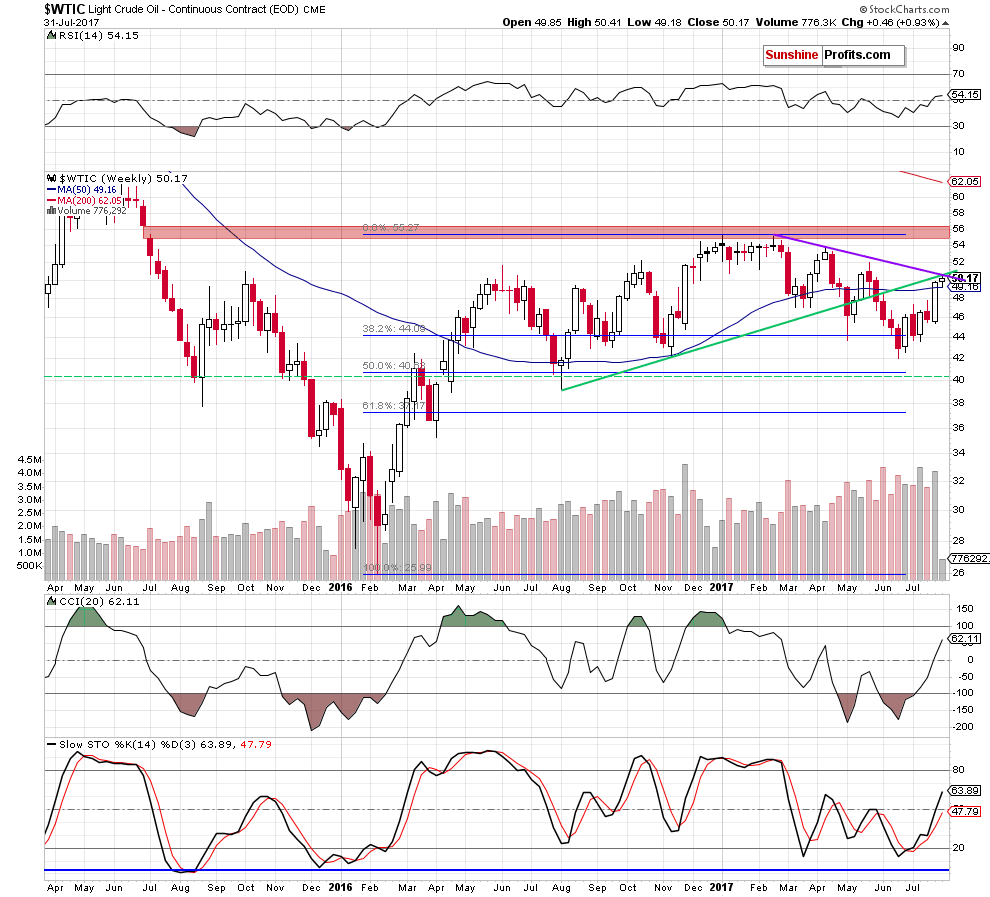
From this perspective, we clearly see that yesterday’s move took crude oil to the purple resistance line based on the previous highs. Additionally, in this area is also the previously-broken medium-term green line based on the August and November lows, which suggests that the recent rebound could be a verification of the earlier breakdown. If this is the case, and we see a reversal in this zone, it will be a strong bearish factor, which could push the black gold to (at least) 2017 lows in the coming weeks.
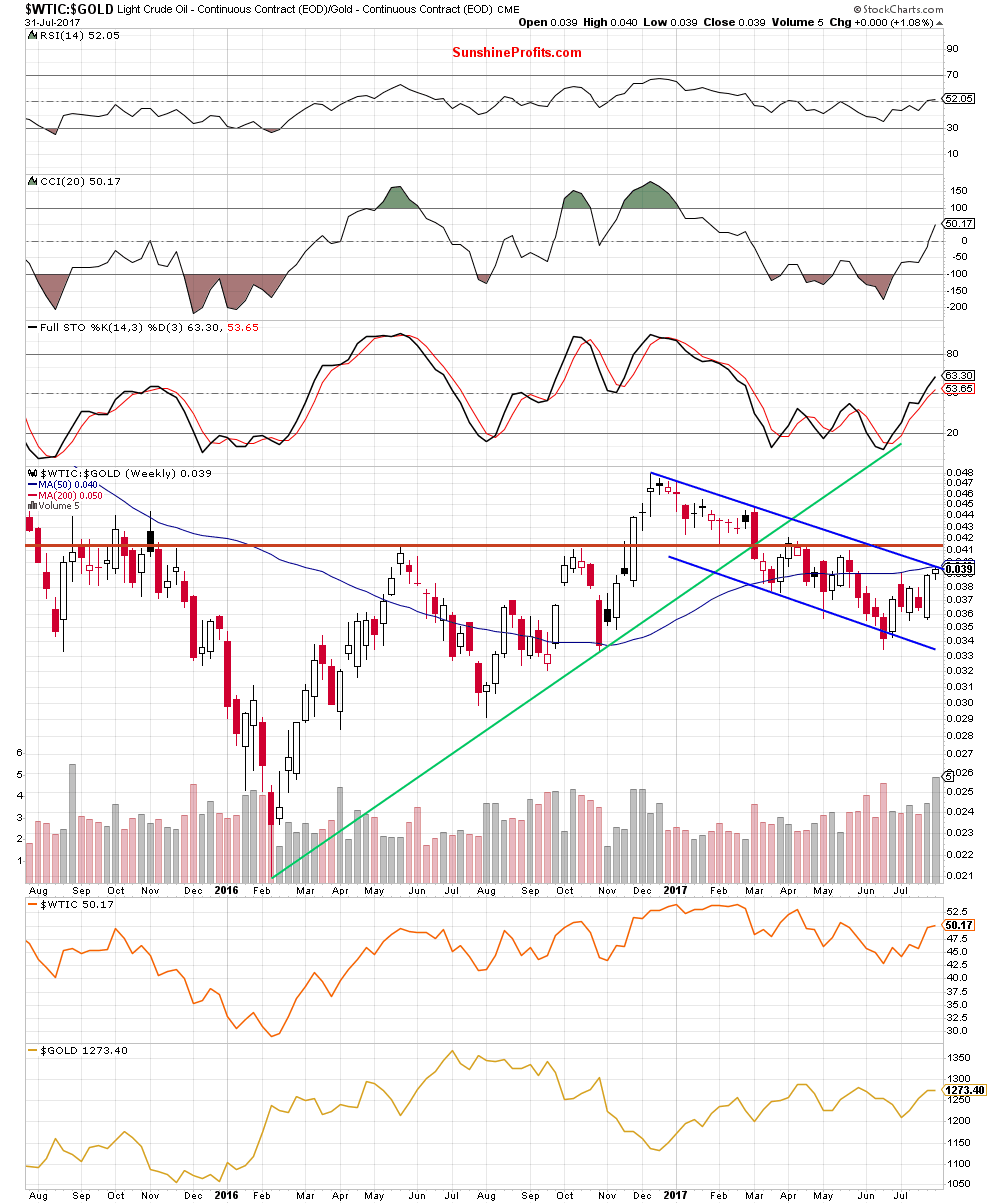
This scenario is also reinforced by the current situation in the oil-to-gold ratio.
Crude Oil – Gold Link
Yesterday, we wrote the following:
(…) although oil-to-gold ratio broke above the upper border of the red declining trend channel, we didn’t see a sharp move to the upside. Instead, the ratio started to consolidate, which increases the probability of reversal in the coming week.
Why? When we take a closer look at the above chart, we see that there was a similar price action in May. Back then, after the breakout above the upper line of the trend channel, the ratio started consolidation, which resulted in a reversal and declines in the following week. Additionally, looking at the daily chart, we see that there were also similar cases in 2016 and they all preceded smaller or bigger declines.
Nevertheless, taking into account the fact that there are no sell signals at the moment of writing these words, one more short-lived upswing can’t be ruled out (similarly to what we saw in the past).
How high could the ratio go?
(…) even if the ratio moves higher one again, very close to the current levels we can notice the upper border of the blue declining trend channel, the 50-week moving average and the July peak, which together could stop bulls and trigger a reversal and declines in the coming week.
Looking at the charts, we see that the situation developed in line with yesterday’s scenario and the ratio extended gains, reaching our upside target. Therefore, in our opinion, a move to the downside from this area is very likely. How such price action could affect the price of crude oil? Taking into account the fact that positive correlation between the ratio and the commodity is still in cards, we believe that declines in the ratio will translate into lower prices of crude oil in the coming week(s).
Finishing today’s Oil Trading Alert, we would like to write a few sentences explaining why we decided to raise the stop-loss level. Please take a look at the monthly chart.
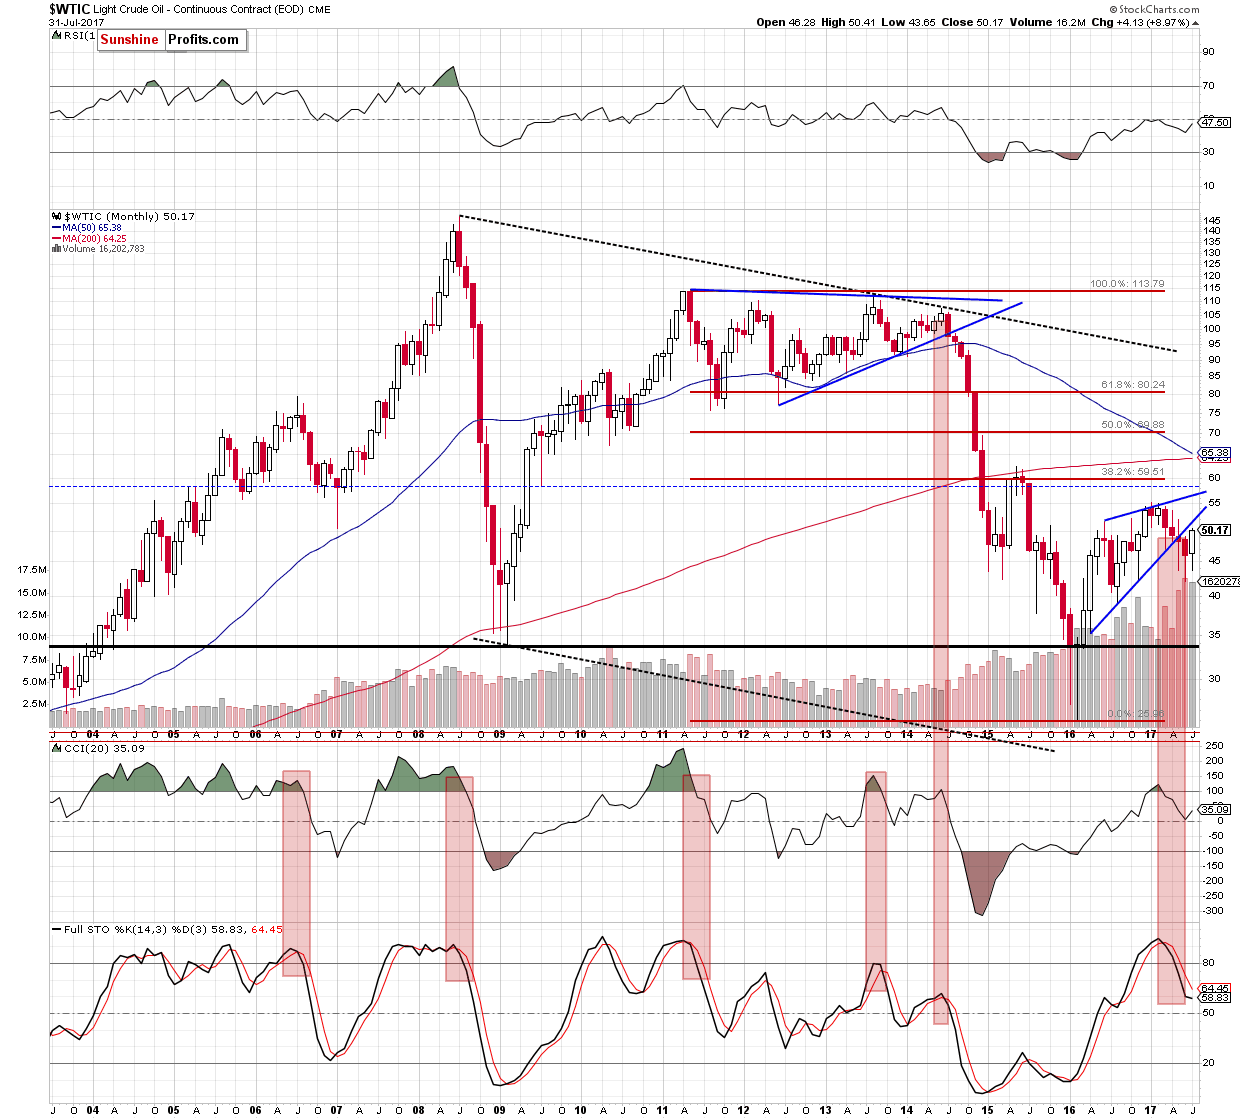
From the long-term perspective, we see that the July comeback above the June high and the barrier of $50, approached crude oil to the previously-broken lower border of the rising wedge, which suggests that if the medium-term purple resistance line together with the 61.8% Fibonacci retracement do not stop oil bulls in the coming days (which is, in our opinion, less likely than declines), we may see an increase to the red resistance zone marked on the daily chart or even a test of the abovementioned lower border of the rising wedge (currently around $52).
If it happens (the worst case scenario) and light crude verifies the earlier breakdown under this important line, oil bears will receive important reason to act and accelerate declines, making our positions profitable in the following days/weeks without a loss caused by a short-lived upswing.
Summing up, crude oil extended gains and climbed slightly above the upper border of the purple rising trend channel, which resulted in a test of the 61.8% Fibonacci retracement and the medium-term declining resistance line based on the previous highs (marked on the weekly chart). Additionally, the oil-to-gold ratio reached important resistances, which together suggests that reversal and lower prices of light crude are just around the corner.
Very short-term outlook: mixed with bearish bias
Short-term outlook: bearish
MT outlook: mixed
LT outlook: mixed
Trading position (short-term; our opinion): Short positions (with a stop-loss order at $52.52 and the initial downside target at $45.80) are justified from the risk/reward perspective. We will keep you – our subscribers – informed should anything change.
As a reminder – “initial target price” means exactly that – an“initial” one, it’s not a price level at which we suggest closing positions. If this becomes the case (like it did in the previous trade) we will refer to these levels as levels of exit orders (exactly as we’ve done previously). Stop-loss levels, however, are naturally not “initial”, but something that, in our opinion, might be entered as an order.
On an administrative note, there will be no regular Oil Trading Alert on Thursday and Friday, but if the situation changes dramatically, we will send you a quick note with our latest analysis and thoughts on that matter.
Thank you.
Nadia Simmons
Forex & Oil Trading Strategist
Przemyslaw Radomski, CFA
Founder, Editor-in-chief, Gold & Silver Fund Manager
Gold & Silver Trading Alerts
Forex Trading Alerts
Oil Investment Updates
Oil Trading Alerts

