

Trading position (short-term; our opinion): No positions are justified from the risk/reward perspective.
On Monday, crude oil wavered between small gains and losses slightly below the nearest resistance line. Where will the black gold head next?
Crude Oil’s Technical Picture
Let’s take a closer look at the charts and find out (charts courtesy of http://stockcharts.com).
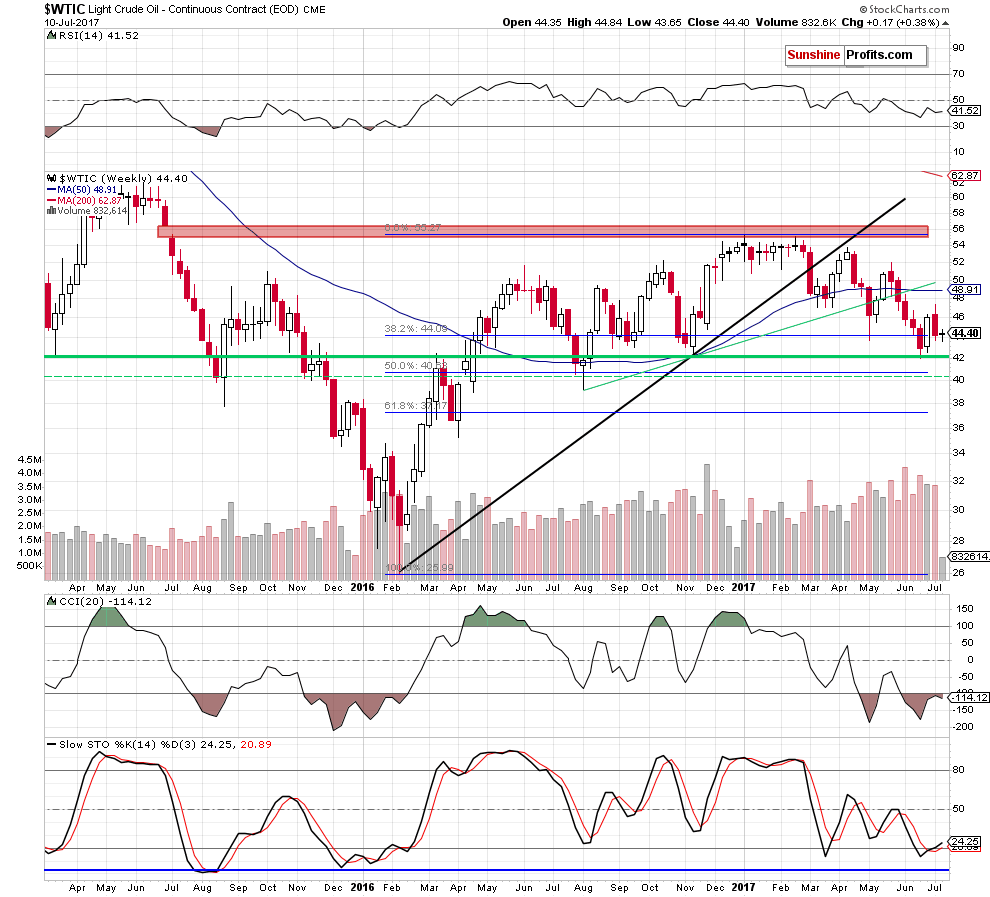
On the weekly chart, we see that although crude oil moved lower earlier this week, the commodity is still trading above the 38.2% Fibonacci retracement, which serves as the nearest support at the moment.
Will it withstand the selling pressure in the coming days? Let’s take a closer look at the daily chart and try to find the answer to this question.
Yesterday, we wrote the following:
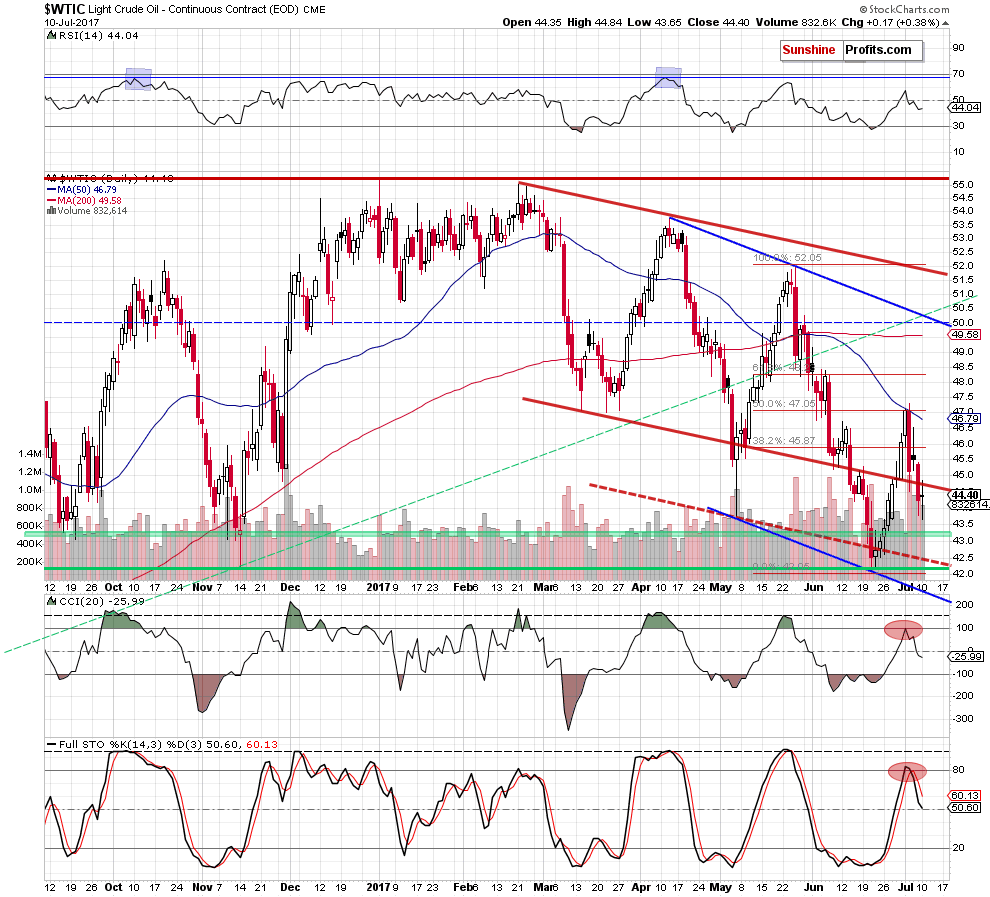
(…) crude oil extended losses and closed Friday’s session under the previously-broken lower border of the red declining trend channel. In this way light crude invalidated the earlier breakout, which is a bearish development.
Additionally, the CCI and the Stochastic Oscillator generated the sell signals, which suggest further deterioration in the coming week. (…) Nevertheless, a short-lived upward move to the lower border of the red declining trend channel before the decline can’t be ruled out.
From today’s point of view, we see that the situation developed in line with the above scenario and oil bulls pushed the black gold to the lower border of the red declining trend channel. Despite this move, they didn’t manage to hold light crude above this line, which resulted in a pullback and a daily closure below this resistance.
What Does Yesterday's Price Action Mean for Crude Oil?
In our opinion, such price action looks like a verification of the earlier breakdown, which suggests further deterioration in the following days. If this is the case and light crude declines from yesterday’s levels, we’ll likely see a realization of the yesterday’s bearish scenario in the very near future:
(…) Taking the above-mentioned factors into account, it seems (…) that the black gold will extend losses and test the green support zone (or even the recent lows) in the coming days.
Summing up, crude oil climbed above the previously-broken lower border of the red declining trend channel, but then pulled back and closed the day below this resistance line, which looks like a verification of the earlier breakdown. If this is the case, we’ll likely see another attempt to move lower in the coming day(s).
Very short-term outlook: mixed
Short-term outlook: mixed with bearish bias
MT outlook: mixed
LT outlook: mixed
Trading position (short-term; our opinion): No positions are justified from the risk/reward perspective. We will keep you – our subscribers – informed should anything change.
Thank you.
Nadia Simmons
Forex & Oil Trading Strategist
Przemyslaw Radomski, CFA
Founder, Editor-in-chief, Gold & Silver Fund Manager
Gold & Silver Trading Alerts
Forex Trading Alerts
Oil Investment Updates
Oil Trading Alerts

