

Trading position (short-term; our opinion): Long positions (with a stop-loss order at $40.40 and the upside target around $50)
On Wednesday, crude oil moved sharply lower after news that Russia would not support deepening oil production cuts. As a result, light crude reversed and declined to the previously-broken lower border of the declining trend channel. Will this support withstand the selling pressure and encourage oil bulls to act once again?
Crude Oil’s Technical Picture
Let’s take a closer look at the charts and find out (charts courtesy of http://stockcharts.com).
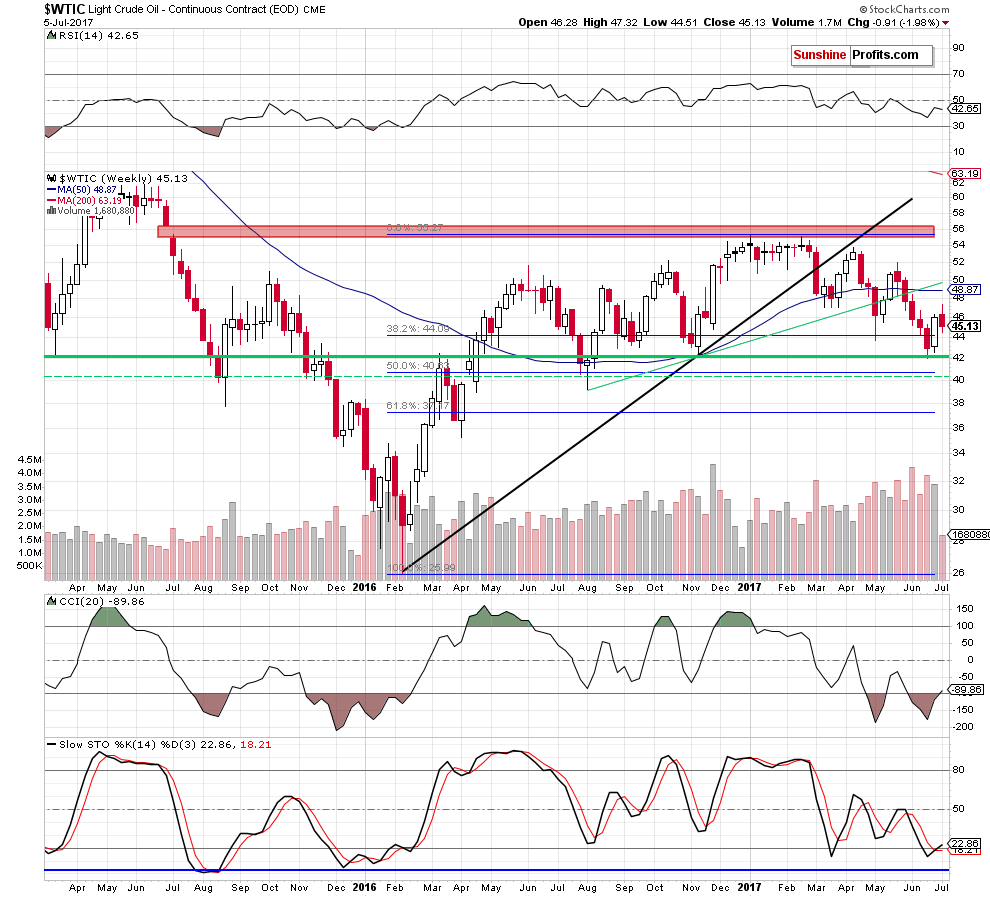
Looking at the weekly chart, we see that although crude oil moved lower yesterday, the buy signals generated by the CCI and the Stochastic Oscillator remain in play, supporting oil bulls and another attempt to move higher. Additionally, despite yesterday’s decline, light crude is still trading above the previously-broken 38.2% Fibonacci retraceent, which means that an invalidation of the breakdown below this support and its positive impact on the price are still in effect.
Are there any other factors that could encourage oil bulls to act once again? Let’s examine the daily chart and find out.
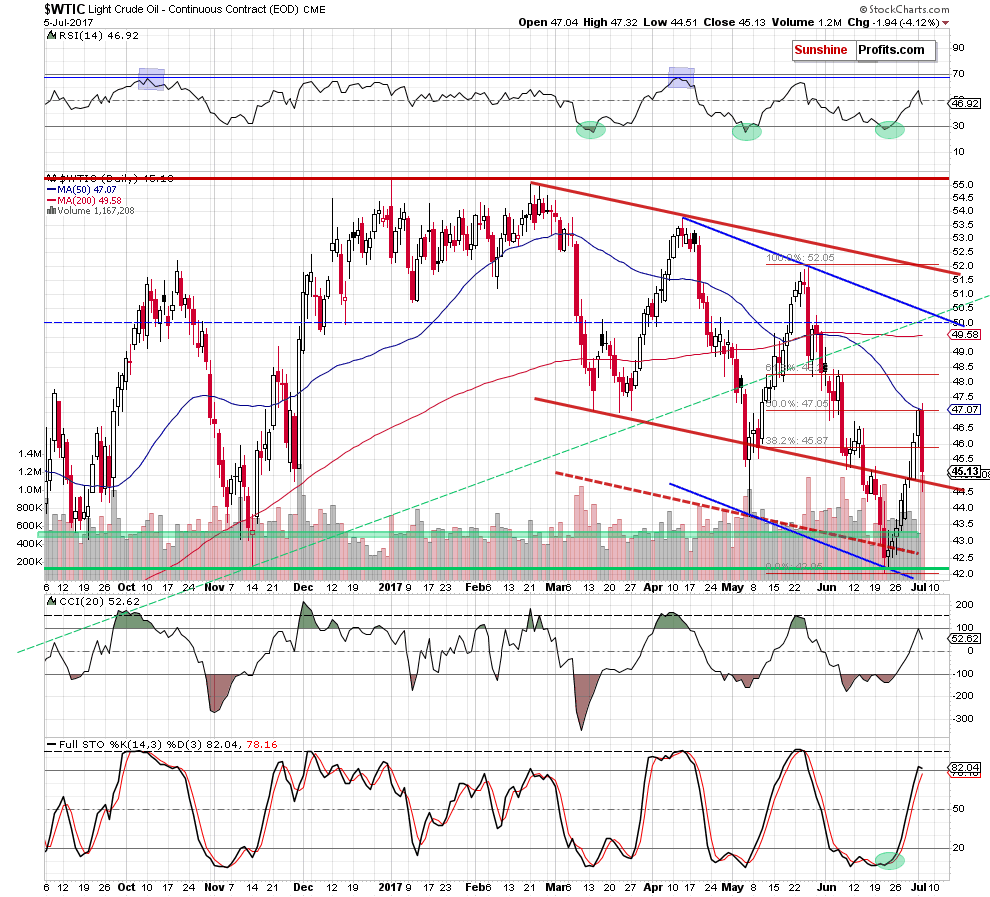
From this perspective, we see that the combination of the 50% Fibonacci retracement and the 50-day moving average stopped currency bulls, triggering a sharp decline yesterday. Thanks to Wednesday’s drop light crude slipped to the previously-broken lower border of the red declining trend channel, which looks like a verification of the earlier breakout. If this is the case, we’ll see further improvement in the coming day(s).
Oil Price Targets
How high could the black gold in the near future? In our opinion, the first upside target will be around $47.07-$47.32, where the 50-day moving average and this week’s high are. If this resistance area is broken, the next resistance levels and likely targets are created by the 61.8% Fibonacci retracement (at $48.23) and (approximately) the $50 level.
At this point it is worth keeping in mind that the $50 level is a very round number, so it’s important from the psychological point of view and it has indeed stopped both rallies and declines in the previous months (we marked it with a blue, dashed line). Moreover, the rising green resistance line and the declining blue resistance line also coincide close to the $50 level.
Finishing today’s Oil Trading Alert, please note that after yesterday’s market’s closure the American Petroleum Institute showed that crude oil inventories fell by 5.8M barrels in the week ending June 30, beating analysts’ expectations for a 1.6M-barrel drop. Additionally, gasoline supplies showed a decline of 5.7M barrels, which affected positively crude oil futures price earlier today. What does it mean for the black gold? If today’s government data confirms these positive numbers, oil bulls will receive a very important reason to act and we’ll likely see another upswing in the following hours.
Summing up, long positions continue to be justified from the risk/reward perspective as it seems that crude oil will move even higher before the next local top is seen.
Very short-term outlook: bullish
Short-term outlook: bullish
MT outlook: mixed
LT outlook: mixed
Trading position (short-term; our opinion): Long positions (with a stop-loss order at $40.40 and the upside target around $50) We will keep you informed should anything change, or should we see a confirmation/invalidation of the above.
Thank you.
Nadia Simmons
Forex & Oil Trading Strategist
Przemyslaw Radomski, CFA
Founder, Editor-in-chief, Gold & Silver Fund Manager
Gold & Silver Trading Alerts
Forex Trading Alerts
Oil Investment Updates
Oil Trading Alerts

