

Please note that due to market volatility, some of the key levels may have already been reached and scenarios played out.
Trading positions
- Crude Oil [CLX21] We projected the $74.83-75.45 level (yellow rectangle) as new support onto which prices could rebound, so we would go long after a dip around that area with a stop just below $73.14 and a target around $79.55. Since we currently think that the barrel is overbought, we expect it to slide back – See Fig. 1
- Natural Gas [NGX21] In our previous edition published last week, we projected that if the market broke below $5.480-5.568 support, we would then readjust our long position to lower levels above $5.073-5.147 support. So, this is exactly what the market did (after rebounding a few times on the same level), and thus an opportunity arose on Tuesday to enter just above this new projected support (just look how prices got rejected back up after almost touching it…).
For risk management, an appropriate stop could be placed just below $4.766 in order to target $5.663-5.790 – See Fig. 2
Our Dynamic Stock Watchlist: https://www.tradingview.com/watchlists/58975734/
Falling oil demand and bearish US inventories are not of any good to WTI investors. However, a deeper slide might be a great place to enter the trade…
Fundamental Analysis
The Organization of Petroleum Exporting Countries (OPEC) has downgraded its estimate of world oil demand for 2021. The demand has been lower than expected so far despite strong prospects for the end of the year.
In fact, in its monthly report, the cartel estimates that oil demand will rebound by 5.82 million barrels per day (mb/d) this year, while it forecast 5.96 mb/d last month.
Global crude demand is therefore expected to reach 96.6 mb/d this year.
As a reminder, the member countries of the cartel and their allies (OPEC+) chose at the beginning of October to renew their strategy of a modest increase in production, ignoring the calls to open the floodgates further and thus propelling prices upwards.
By the way, the two oil-producing countries that contributed the most to this increase are Nigeria and Saudi Arabia.
U.S. API Weekly Crude Oil Stock
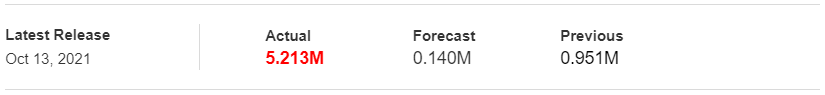
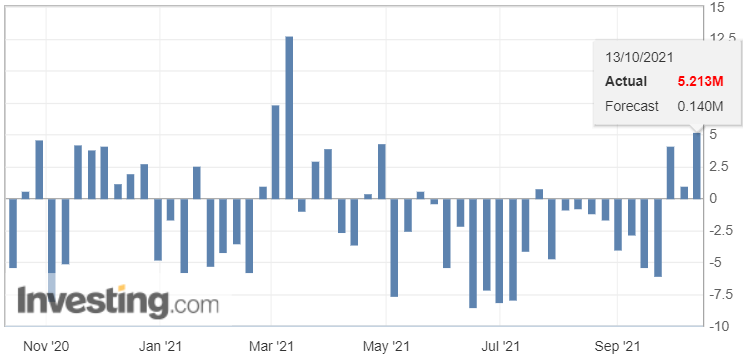
Inventory levels of US crude oil, gasoline and distillates stocks, American Petroleum Institute (API) via Investing
Regarding the API figures published on Wednesday, the increase in crude inventories (with 5.213 million barrels versus 140k) was more than expected — this implies weaker demand and is bearish for crude prices. However, we have yet to see whether or not these figures are confirmed by the weekly Energy Information Administration's (EIA) report published later today.
If this scenario is confirmed by the EIA’s figures later today, then the black gold will be well set for a deeper correction, possibly back to its lower support levels – levels which, by the way, were provided yesterday to our premium subscribers, along with our most recent projections.
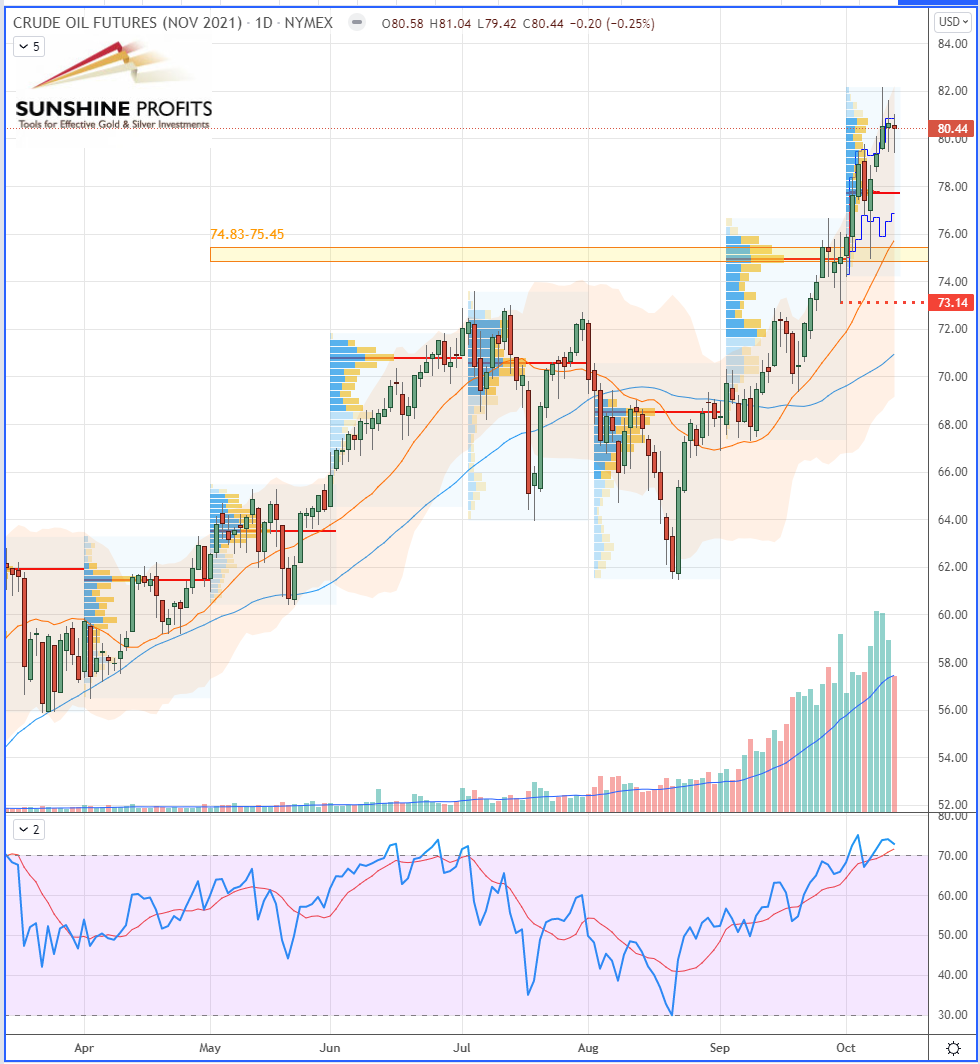
Figure 1 – WTI Crude Oil (CLX21) Futures (November contract, daily chart)
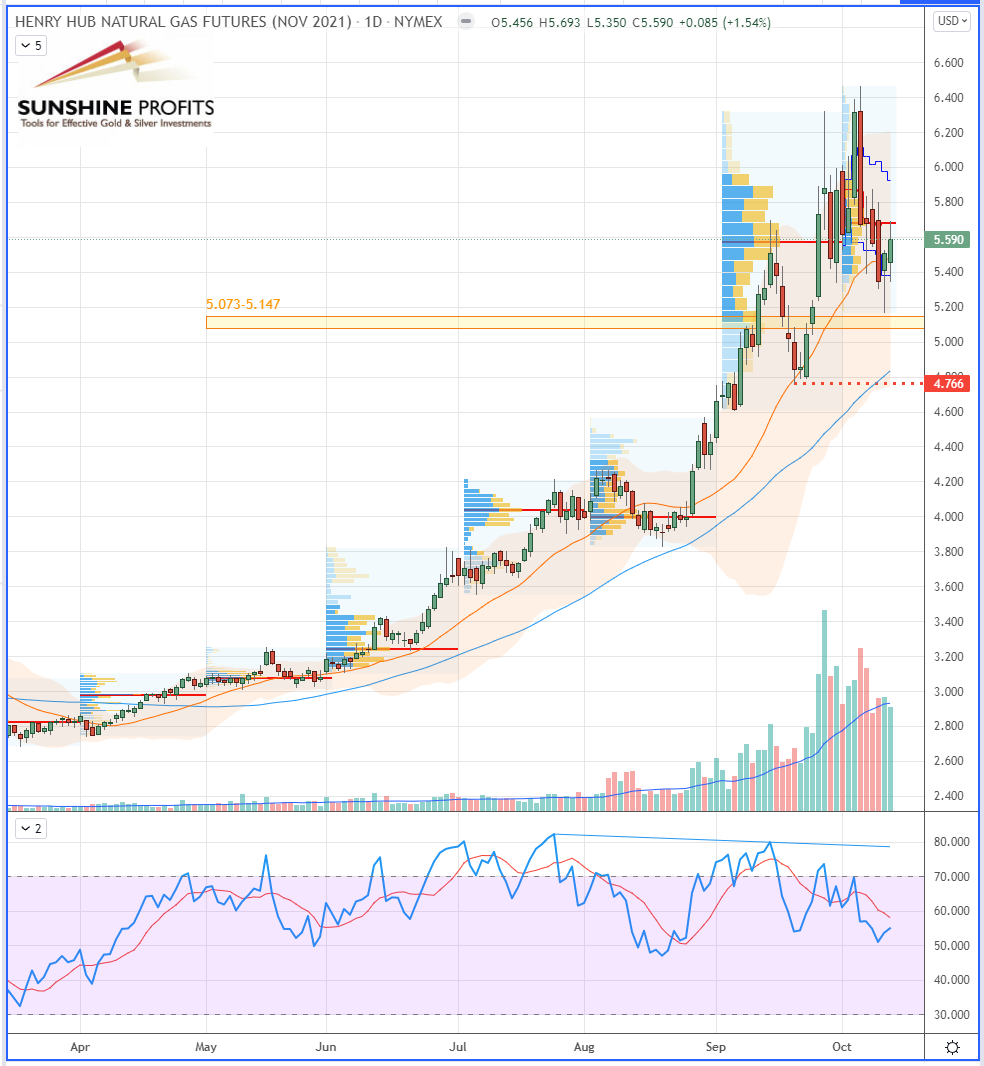
Figure 2 – Henry Hub Natural Gas (NGX21) Futures (November contract, daily chart)
Finally, to wrap up today’s article, we have seen a few choppy days on the energy markets with some contradictory data to interpret. This uncertainty usually leads to a ranging market, which can be an interesting place for some shorter-term trades. For a longer-term trade horizon, it is necessary to combine some fundamental analysis with your charting and be patient.
This is exactly what we do here, and we are happy to help you surf on the waves of uncertainty!
As always, we’ll keep you, our subscribers, well-informed.
Please note that due to market volatility, some of the key levels may have already been reached and scenarios played out.
Trading positions
- Crude Oil [CLX21] We projected the $74.83-75.45 level (yellow rectangle) as new support onto which prices could rebound, so we would go long after a dip around that area with a stop just below $73.14 and a target around $79.55. Since we currently think that the barrel is overbought, we expect it to slide back – See Fig. 1
- Natural Gas [NGX21] In our previous edition published last week, we projected that if the market broke below $5.480-5.568 support, we would then readjust our long position to lower levels above $5.073-5.147 support. So, this is exactly what the market did (after rebounding a few times on the same level), and thus an opportunity arose on Tuesday to enter just above this new projected support (just look how prices got rejected back up after almost touching it…).
For risk management, an appropriate stop could be placed just below $4.766 in order to target $5.663-5.790 – See Fig. 2
Our Dynamic Stock Watchlist: https://www.tradingview.com/watchlists/58975734/
Thank you.
Sebastien Bischeri
Oil & Gas Trading Strategist

