

Trading position (short-term; our opinion): No positions are justified from the risk/reward perspective.
A climb above the 200-week moving average, an invalidation of the earlier breakdown under another moving average, several buy signals and a gap. What effect can the combination of these technical elements have on the very short-term picture of black gold in the coming days?
Let's start today’s alert with the long-term chart (charts courtesy of http://stockcharts.com).
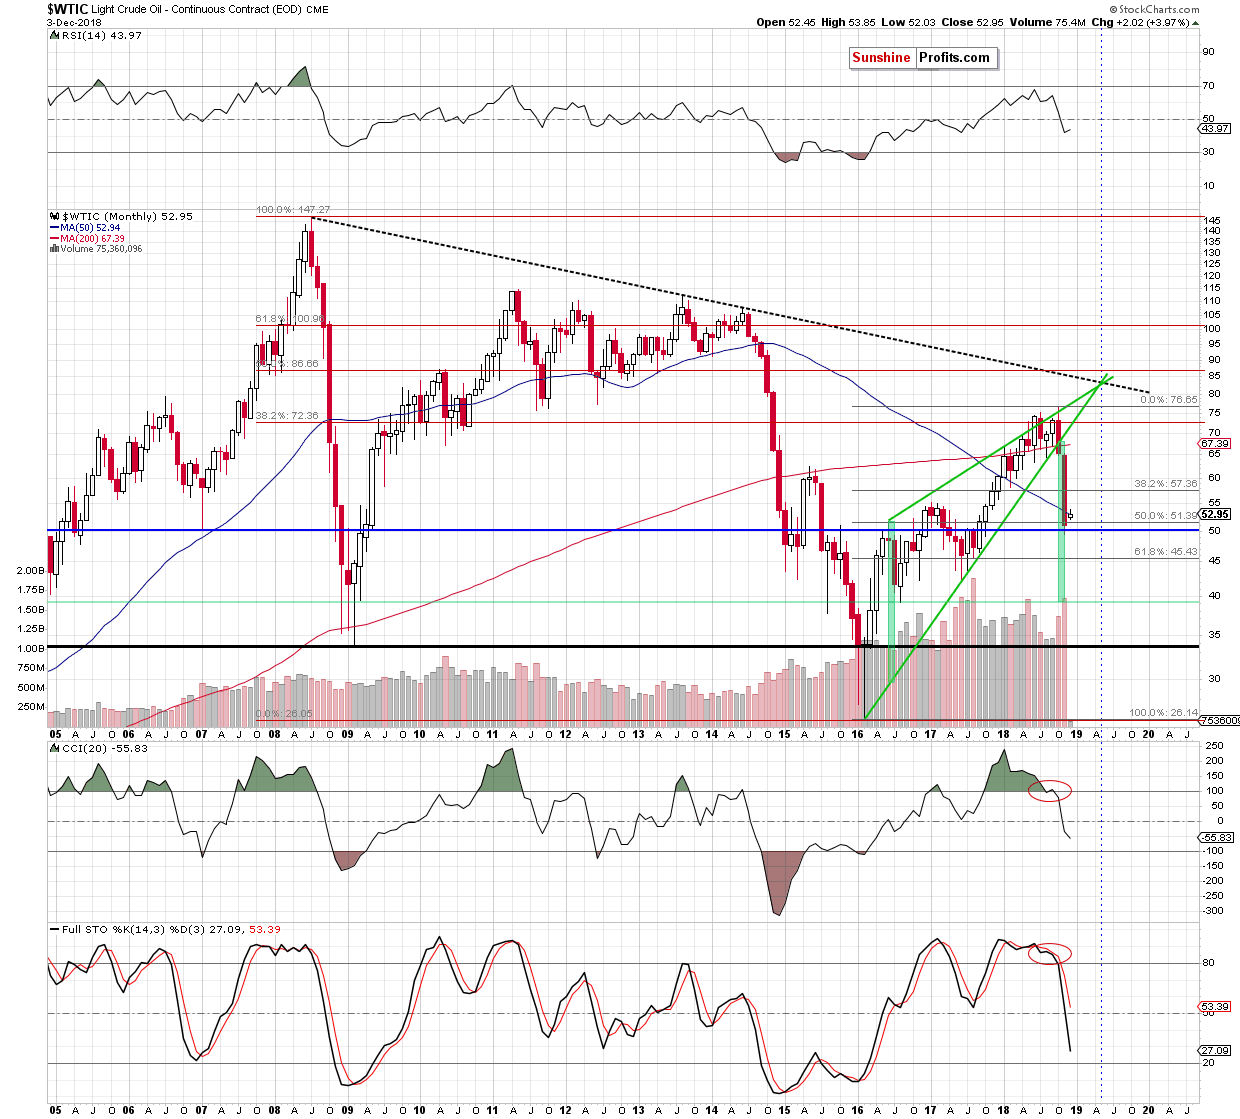
The first thing that catches the eye on the monthly chart is crude oil’s “climb” above the 50-month moving average. Although this could be a first sign of positive changes in the price of the commodity, we should keep in mind that December has just begun and a 1 cent increase above this resistance cannot be handled yet as an improvement – especially when we factor in the quote from yesterday’s alert:
(…) size of the last week’s volume was huge, which confirms the sellers’ strength and their involvement in the November’s correction. Additionally, the sell signals generated by the monthly indicators remain in the cards, suggesting that the worst might be still ahead of the buyers.
Did Monday’s upswing change anything in the medium-term chart?
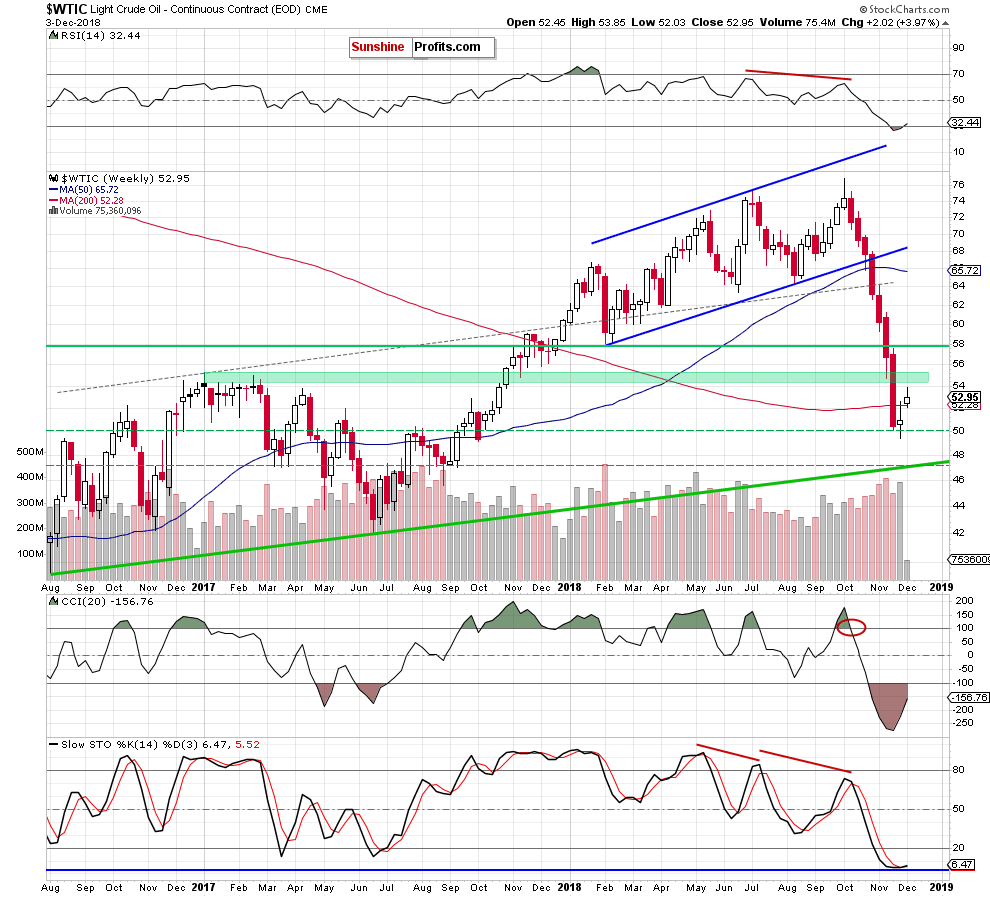
Yes, but only at the first glance. Why? As you see on the weekly chart, the price of black gold moved above the last week’s major resistance – the 200-week moving average and closed the day above it. Although this may look encouraging (especially when we add the buy signal generated by the Stochastic Oscillators), please keep in mind that the week has just begun and therefore, in our opinion, until we see the end of the week above that resistance, it cannot be considered as a bull's ally.
Having said the above, let’s check what can we infer from the daily chart.
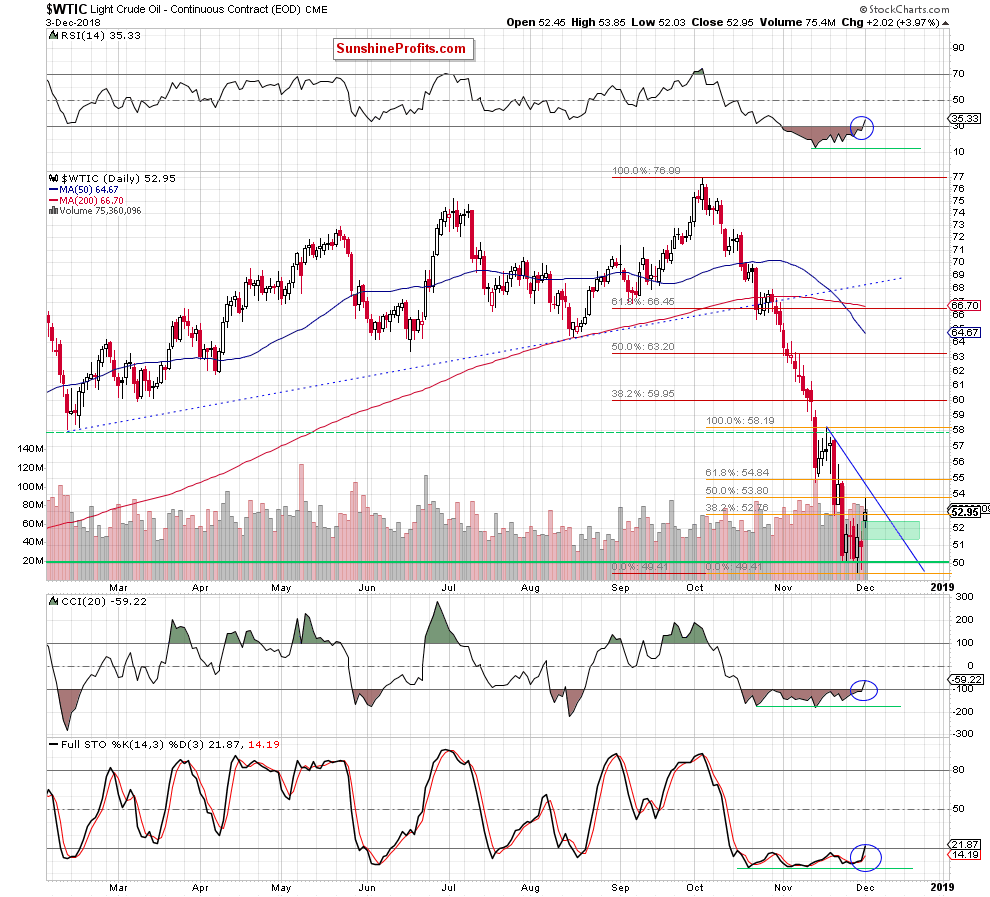
From this perspective we see that crude oil opened this week above Friday’s closure, which resulted in the creation of the green gap. As you see on the chart, although the sellers tried to push the commodity lower, their attempts failed because the gap encouraged the buyers to act.
Thanks to this support, oil bulls took light crude to the 50% Fibonacci retracement based on the last wave of the downward move (marked with orange) but didn’t manage to hold gained levels. As a result, the commodity pulled back, closing the day slightly above the 38.2% retracement.
What’s next for black gold?
The buy signals generated by all the daily indicators in combination with the above-mentioned “improvements” suggest that higher prices of light crude are just around the corner. Nevertheless, in our opinion, they are not credible enough to trust them and open long positions – especially when we factor in the fact that crude oil didn’t even break above the blue resistance line based on the previous highs.
Therefore, we continue to think that waiting at the sidelines for more reliable technical factors is justified from the risk/reward perspective. We’ll keep you - our subscribers - informed should anything change.
Trading position (short-term; our opinion): No positions are justified from the risk/reward perspective.
Thank you.
Nadia Simmons
Forex & Oil Trading Strategist
Przemyslaw Radomski, CFA
Founder, Editor-in-chief, Gold & Silver Fund Manager
Gold & Silver Trading Alerts
Forex Trading Alerts
Oil Investment Updates
Oil Trading Alerts

