

Trading position (short-term; our opinion): Short position with a stop-loss order at $68.54 and the initial downside target at $58.71 is justified from the risk/reward perspective.
Examining the daily chart, the bullish case for oil looks to have as many holes as Swiss cheese. Is that the record U.S. production and rising inventories at play? Was that the straw that broke oil bulls' back or can the bulls pull a rabbit out of their hats?
Let's take a closer look at the chart below (chart courtesy of http://stockcharts.com).
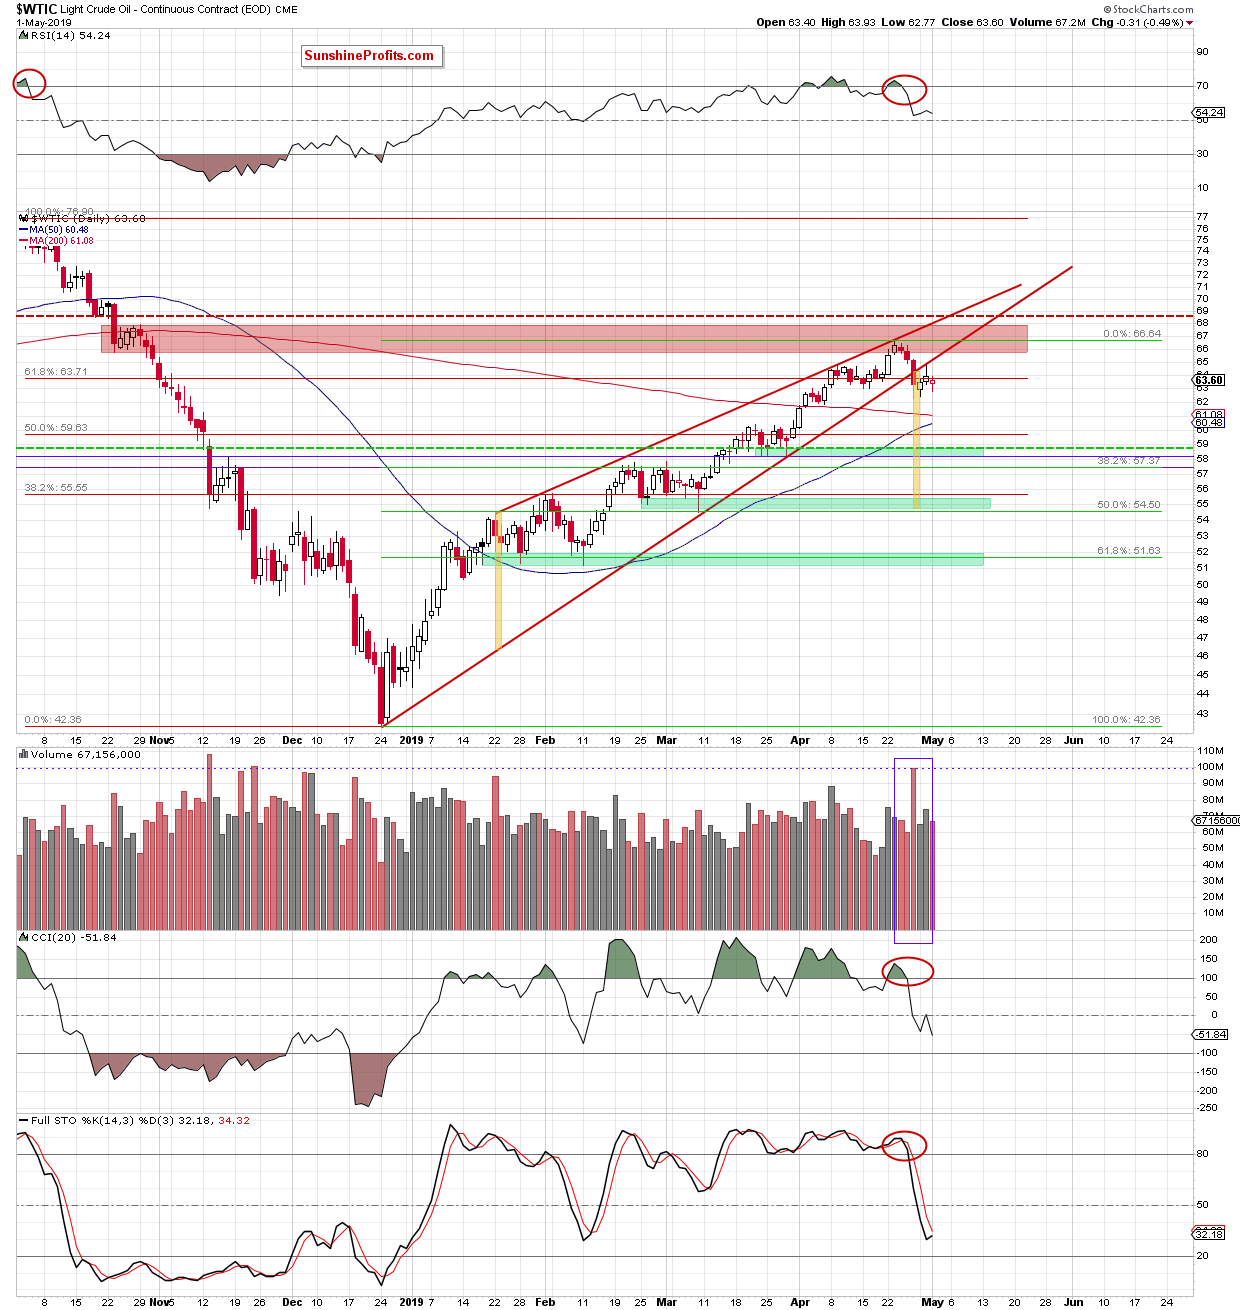
Crude oil has moved lower during yesterday's session. It closed the day below the 61.8% Fibonacci retracement. The daily indicators support the bearish case for oil. They suggest that lower oil prices are still ahead of us.
Indeed, looking at today's trading action shows bears in action: the price is currently right below yesterday's lows at around $62.70. It looks to have embarked south after the verification of the breakdown from the rising red wedge.
How low could it fall? Even lower than the first green support zone. Black gold could visit the second green support zone because there the size of the decline would correspond to the height of the wedge that it has broken down from.
Summing up, the bearish outlook strengthened. There has been no upswing attempt since the verification of the breakdown below the rising red wedge. Instead, the downside momentum appears to gather pace. The daily indicators remain on sell signals. The bearish divergences are in place and the short position continues to be justified.
Trading position (short-term; our opinion): Short position with a stop-loss order at $68.54 and the initial downside target at $58.71 is justified from the risk/reward perspective.
Thank you.
Nadia Simmons
Forex & Oil Trading Strategist

