

Trading position (short-term; our opinion): No positions are justified from the risk/reward perspective.
On Thursday, crude oil extended gains, which approached the commodity to the level of $65 per barrel. But is the undertone of the whole session as positive as it might seem at the glance?
Technical Picture of Crude Oil
Let’s start today’s alert with the long-term chart of black gold (charts courtesy of http://stockcharts.com).
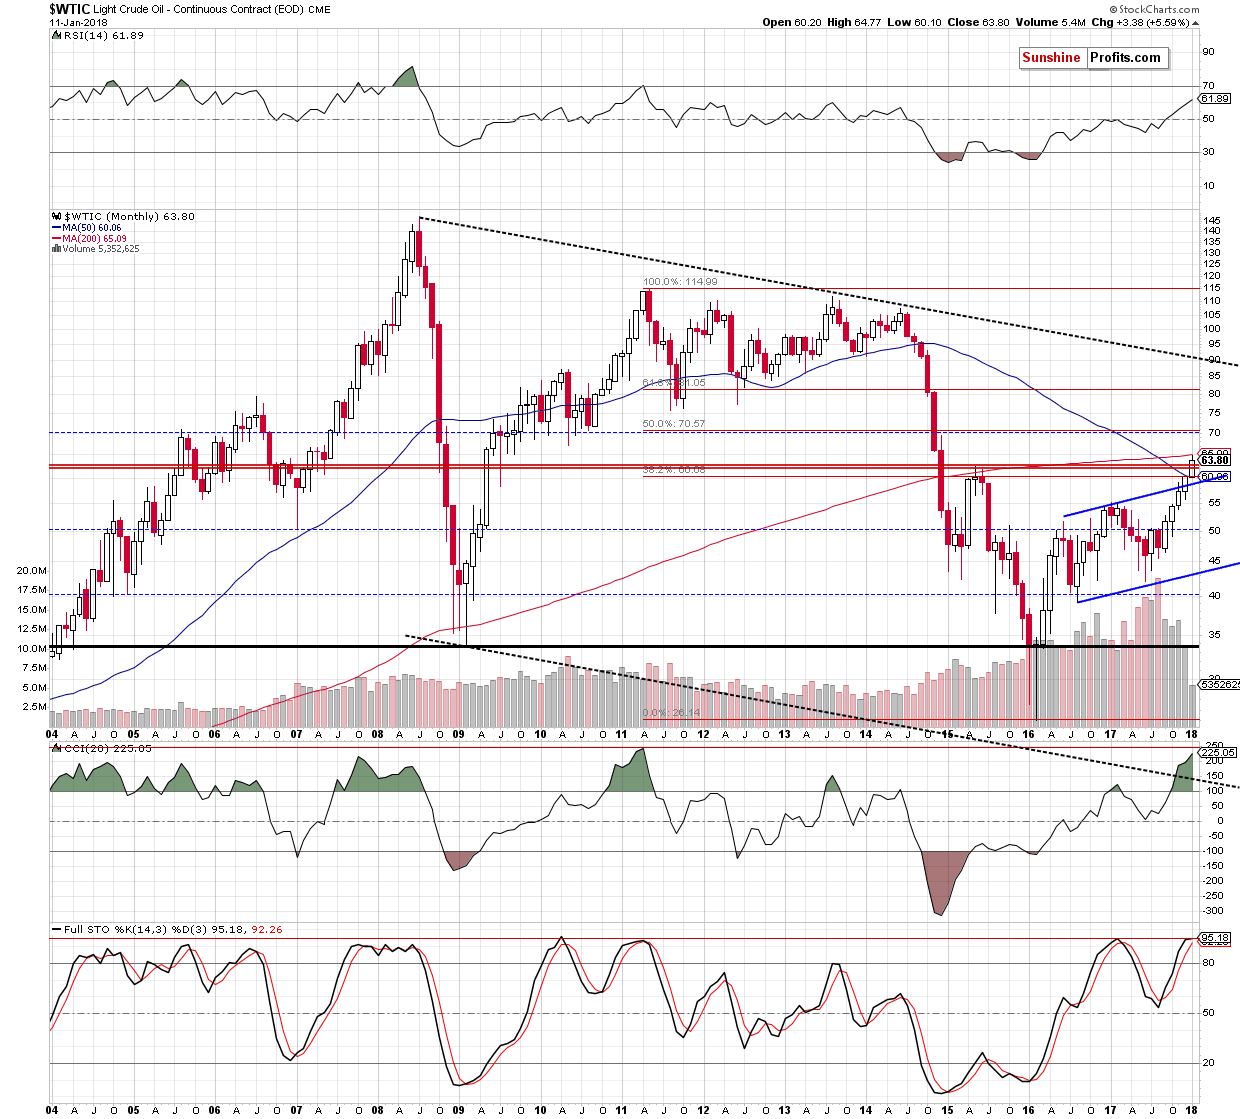
Before we comment on Thursday price action, let's recall a quote from yesterday's alert:
(…) crude oil extended gains above the May 2015 high, hitting a fresh 2018 peak (…) which suggests a test of the 200-month moving average of $65 in the coming week.
From today’s point of view, we see that we didn’t have to wait until next week to see the price of oil is approaching our upside target. How did this move affect the daily chart? Let’s check.
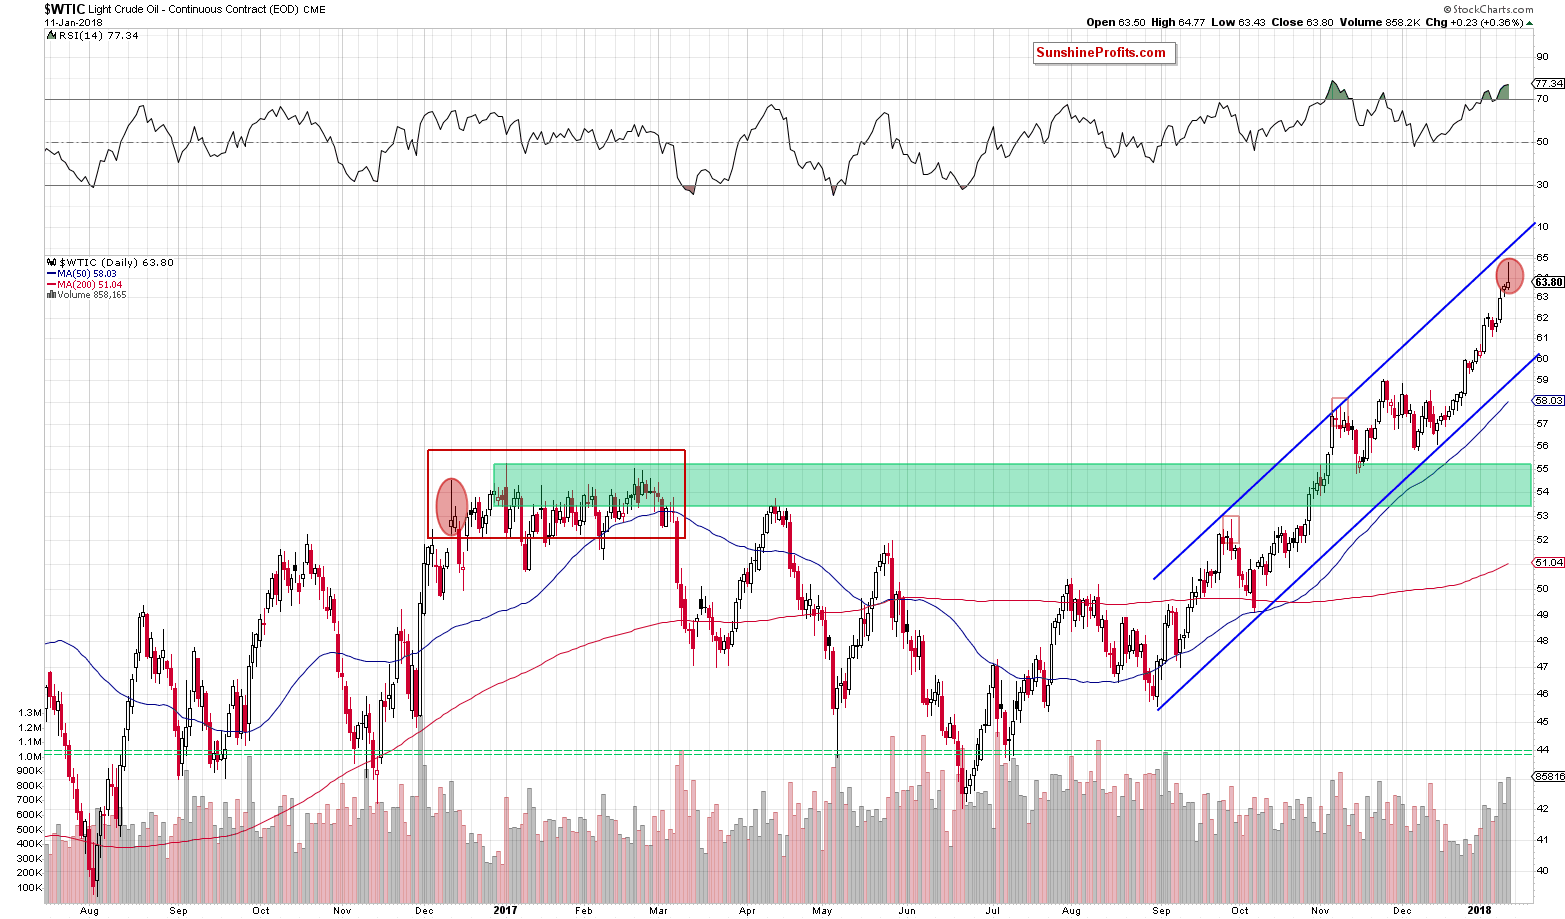
What interesting appeared on the daily chart after yesterday's session?
More experienced investors who are interested in the market for a long time could see this candlestick formation on the charts many times in the past. However, if you are at the beginning of your investment adventure, you do not know much about these "Japanese inventions" or simply don’t remember this pattern let us write something more about it.
Bearish Candlestick and Its Implications
So, what caught our attention? The shooting star, which is the most popular and characteristic one-candle formation of the reversal of the upward trend, announcing declines. It has a long upper shadow, a small body (in our case it is white, but it also can be black) and a small lower shadow. The upper shadow should be larger than the body from 2 to 3 times and there are cases that there is no lower shadow or it is barely visible – like yesterday.
What is the psychological overtone of this formation? Simply speaking, it is a sign of a sudden weakening of the power of demand. The place where the price reached was the level of profit taking after an uptrend and oil bulls didn’t give up here without a reason. What could be the reason in our yesterday’s case? We think it was the mentioned earlier resistance – the 200-month moving average.
Investors who closed their positions after an intraday high caused that the market reversed and declined. Those who had long positions get a clear signal that the price of the commodity reached a significant resistance level .
Such thinking usually causes an avalanche closing position and opening opposing ones, which accelerates declines in the following days. At this point, it is worth noting that if the body of the shooting star is black, it even more affects the imagination of investors. Why? Because, it indicates that the bears took control in the period represented by the candlestick.
Returning, however, to yesterday's session… as you can see on the daily chart, yesterday's candle materialized on a significant volume, but looking at its shape, we think that the increase in volume was caused mainly by oil bears who pushed light crude almost to the opening price.
When was the last time we saw a similar situation? On December 12, 2016 and what's interesting, back then, the shooting star also materialized on big volume. What happened in the following days? As you can see on the chart, almost the entire upward move, which preceded this candlestick formation was erased and black gold approached the earlier December lows. Although the rebound that followed this decline took crude oil to the early January 2017 peak, until the November 3, 2017, we didn’t see a daily closure above the shooting star high.
What all the above could mean for black gold? In our opinion, we’ll see a correction of the recent upward move and a drop to (at least) around $61.30- $61.45 in the coming week. However, if the daily indicators generate sale signals once again, declines may reach even the lower line of the blue rising trend channel (currently around $59.20).
How can this knowledge help us? If we see any reliable show of oil bulls’ weakness later in the day (for example, a red candle on significant volume), we’ll consider opening small short positions.
As always, we’ll keep you - our subscribers - informed should anything change, or should we see a confirmation/invalidation of the above.
Thank you.
Nadia Simmons
Forex & Oil Trading Strategist
Przemyslaw Radomski, CFA
Founder, Editor-in-chief, Gold & Silver Fund Manager
Gold & Silver Trading Alerts
Forex Trading Alerts
Oil Investment Updates
Oil Trading Alerts

