

Trading position (short-term; our opinion): Profitable short positions with a stop-loss order at $71.34 and the next downside target at $66 are justified from the risk/reward perspective.
Although crude oil gained 0.93% on Tuesday, the overall situation in the short term hasn’t changed as much as you could expect after almost 1% growth. But this is not the worst. The picture that emerges from the long-term chart in combination with the current situation in the oil-to-stocks ratio suggests that oil bulls will not sleep well in the coming week(s).
For details, let’s take a closer look at the charts below (charts courtesy of http://stockcharts.com).
Technical Picture of Crude Oil
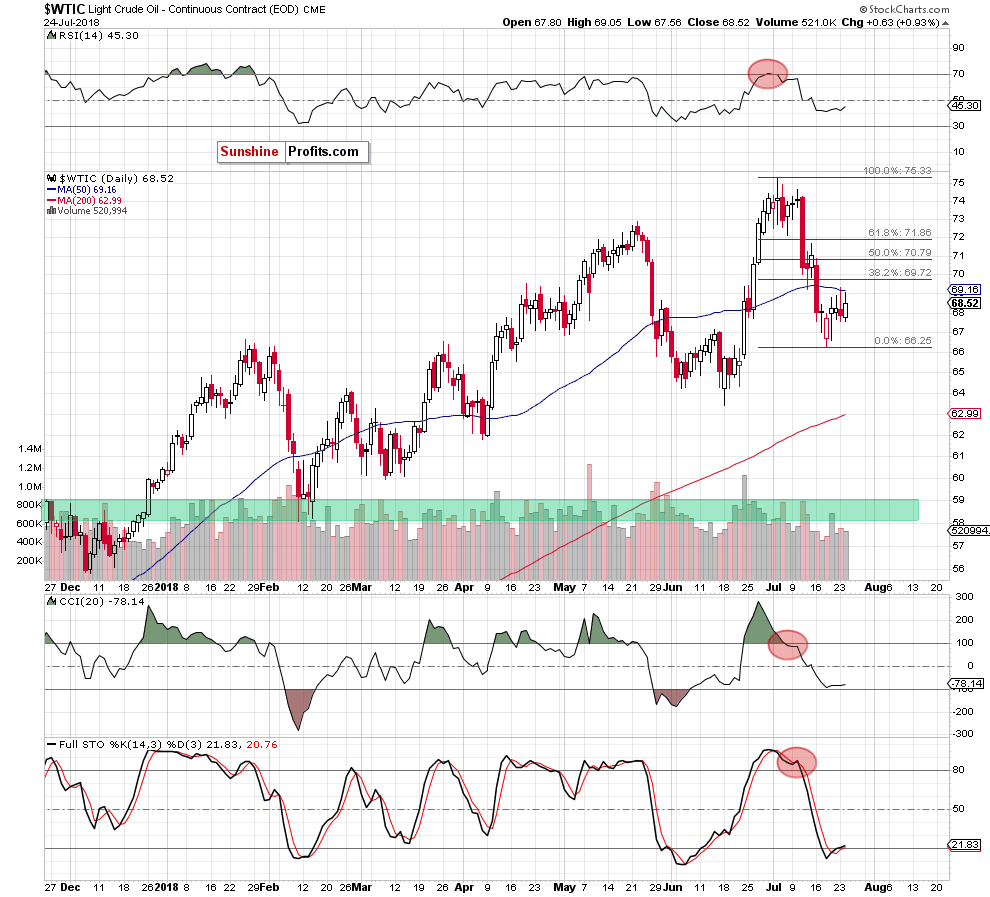
Looking at the daily chart, we see that although oil bulls managed to push the price of light crude higher during yesterday’s session, the 50-day moving average stopped them once again, triggering a pullback.
Moreover, Tuesday’s increase materialized on smaller volume than Monday’s decline, which may be another signal of approaching oil bull's weakness – especially when we factor in the fact that the buyers didn’t even manage to test the 38.2% Fibonacci retracement despite two attempts to go higher.
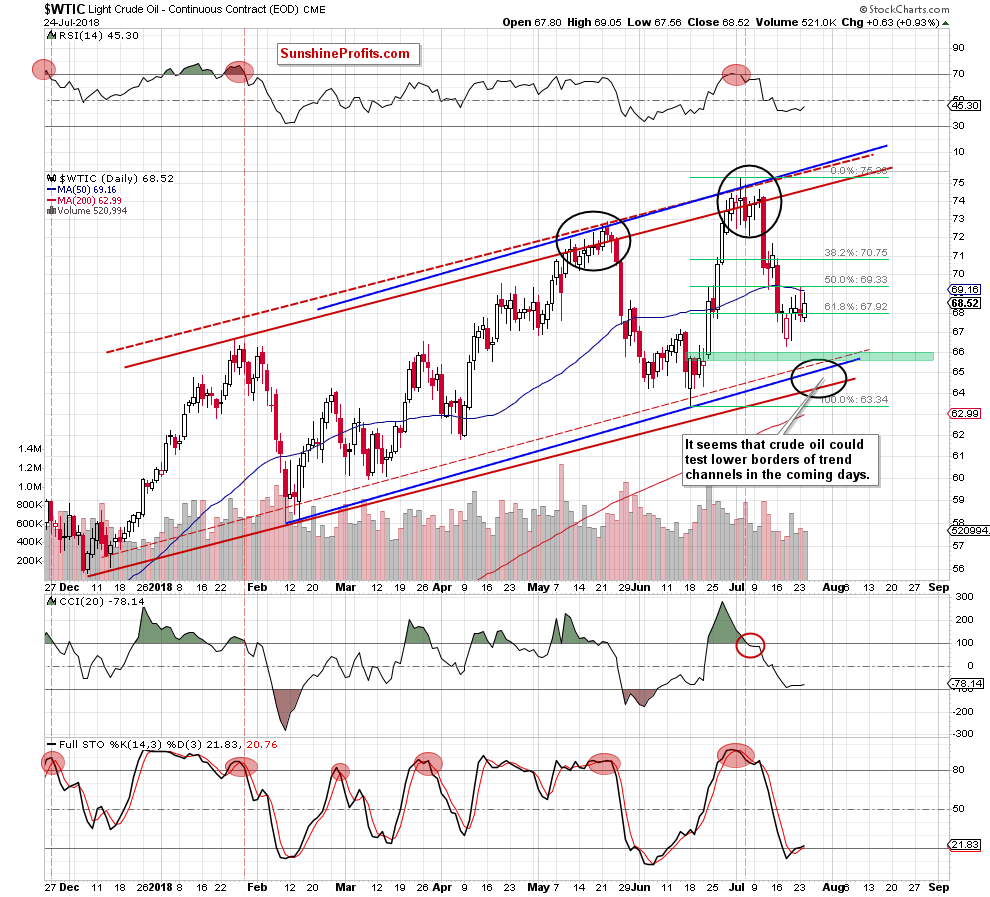
If this is the case and the price of the commodity reverses and declines from current levels, black gold will likely hit a fresh July low and test the support zone created by the lower borders of rising trend channels (marked with the black ellipse) in the coming days.
The pro-bearish scenario is also reinforced by two important negative developments seen more clearly from the broader perspective. Let’s examine the monthly chart below to find out what we mean by that.
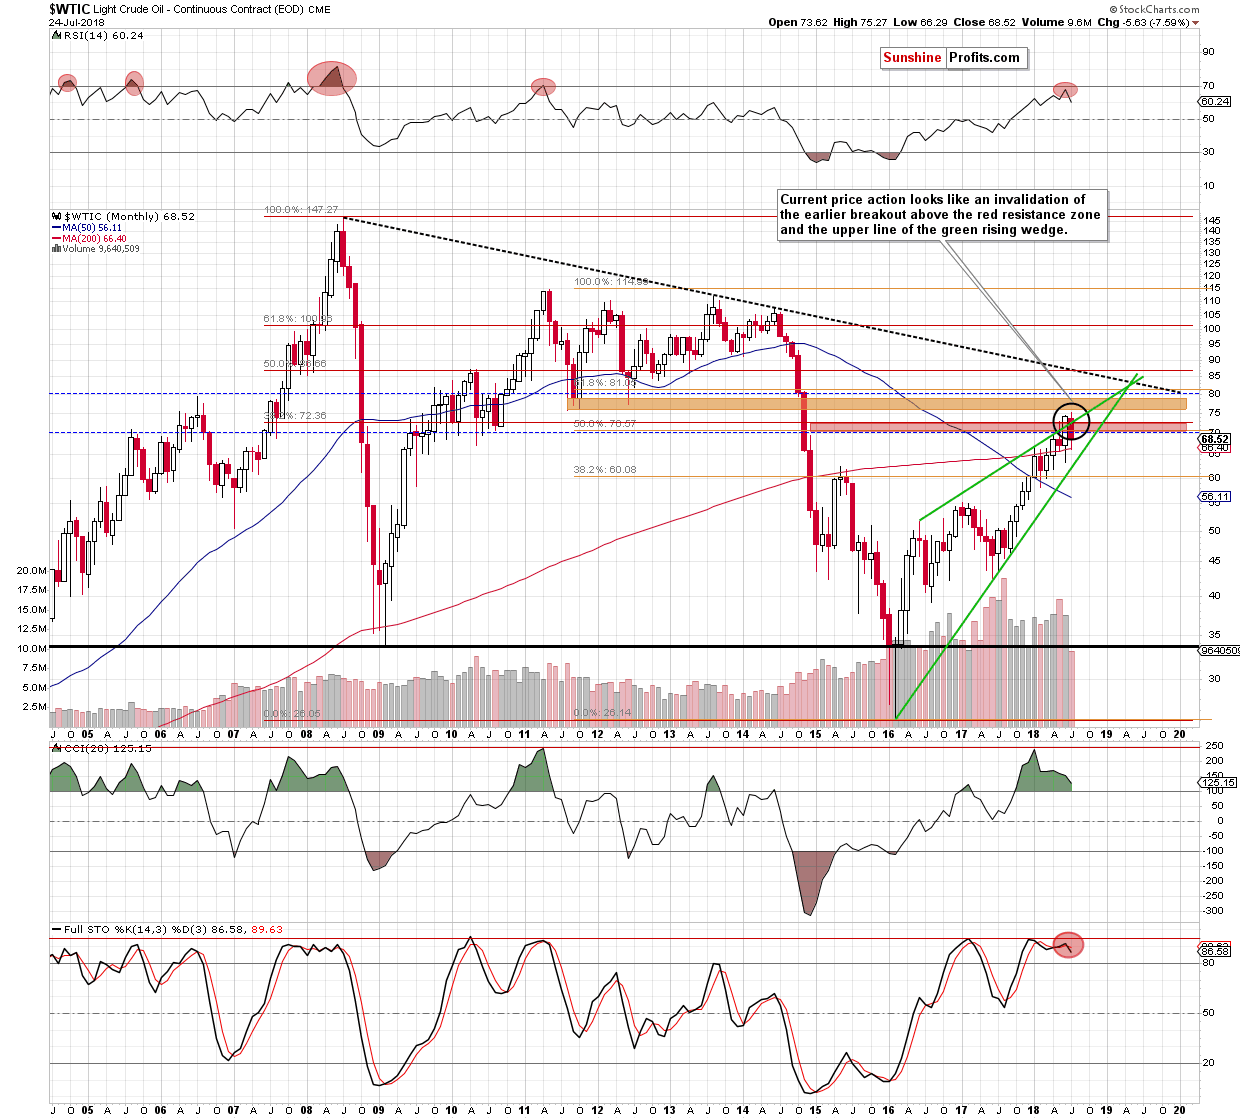
Looking at the above chart, we see that although crude oil bounced off the 200-month moving average earlier this month, the commodity remains under the previously-broken red resistance zone (created by the two important Fibonacci retracements) and the upper border of the green rising wedge.
This means that an invalidation of the earlier breakouts and its negative impact on the price of light crude are still in effect, suggesting that if we see a monthly closure below the above-mentioned resistances oil bears will get one more important reason to push black gold lower in the coming month(s).
Are there any other negative technical factors on the horizon that could encourage oil bears to act in the coming week(s)? Oh yes, they are and you can see one of them on the weekly chart of the oil-to-stocks ratio below.
Crude Oil – General Stock Market Link
In our Oil Trading Alert posted on July 6, 2018 we wrote the following:
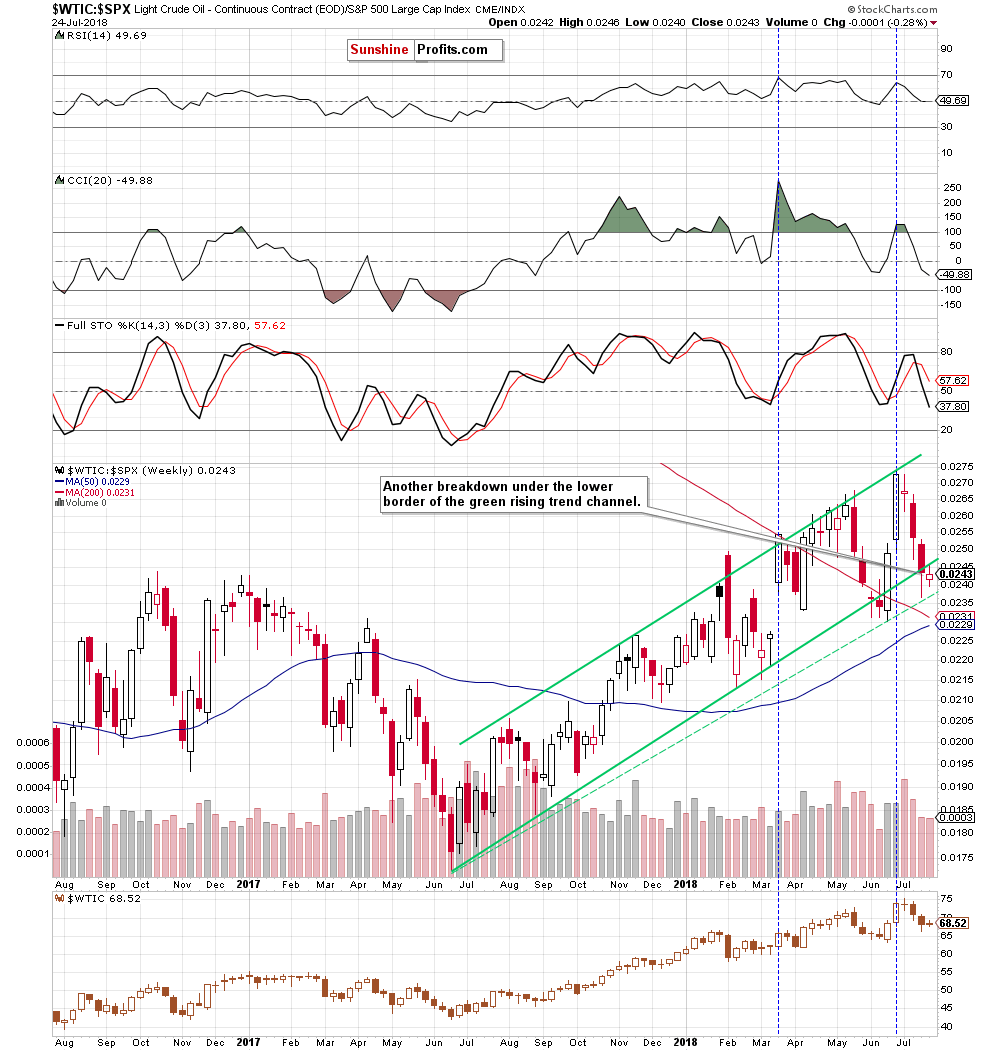
The first that caches the eye on the above chart is another unsuccessful attempt to go above the upper border of the green rising trend channel. (…) although the buyers pushed the ratio sharply higher in the previous weeks, this major resistance line stopped them – similarly to what we saw 12 times in the past!
(…) additionally (…) despite breakouts in February, March and at the end of April, the ratio didn’t manage to move higher, which translated into declines in the following week(s).
What’s even more interesting, the bulls fought fiercely with this resistance for just over a month (between mid-April and the last candle closing the week of May 21), but all their efforts ended in failure. As a result, the value of the ratio dropped sharply, reaching the lower border of the green rising trend channel in the following weeks.
What does it mean for the price of crude oil?
Taking into account a very strong positive correlation between light crude and the ratio (please note that it is even stronger than in previous months), we believe that another decline in the ratio will be reflected in the fall in oil prices.
From today’s point of view, we see that oil bears pushed the ratio lower in recent weeks just as we had expected. Thanks to this decline, the price of crude oil also moved lower, which means that the above-mentioned strong positive correlation between the commodity and the ratio is still in the cards.
So, what can we expect in the near future?
As you see on the weekly chart, the ratio dropped quite sharply in the previous week, which resulted in a drop under the lower border of the green rising trend channel. Although the buyers took it higher, the ratio closed the previous week under this resistance line, which doesn’t bode well for further improvement – especially when we factor in the current price action, which looks like a verification of the earlier breakdown.
If this is the case and the ratio declines once again, we’ll likely also see lower prices of crude oil in the following days. The pro-bearish scenario is also reinforced by the position of the indicators as the sell signals generated by the CCI and the Stochastic Oscillator continue to support the sellers.
Summing up, profitable short positions continue to be justified from the risk/reward perspective as the short-term outlook remains bearish, favoring oil bears and lower prices of crude oil.
Trading position (short-term; our opinion): Profitable short positions with a stop-loss order at $71.34 and the next downside target at $66 are justified from the risk/reward perspective.
Thank you.
Nadia Simmons
Forex & Oil Trading Strategist
Przemyslaw Radomski, CFA
Founder, Editor-in-chief, Gold & Silver Fund Manager
Gold & Silver Trading Alerts
Forex Trading Alerts
Oil Investment Updates
Oil Trading Alerts

