

Trading position (short-term; our opinion): Short position with a stop-loss order at $68.54 and the initial downside target at $58.71 is justified from the risk/reward perspective.
The bulls have had a bad day yesterday. Not that their situation looks any brighter today. As they were repeatedly unable to overcome a powerful combination of resistances ahead, we didn't have to wait for the response of the bears much longer. It came with full force and the question of where the slide can stop fits the mood perfectly. Let's dive into the rich details.
Let's take a closer look at the chart below (charts courtesy of http://stockcharts.com).
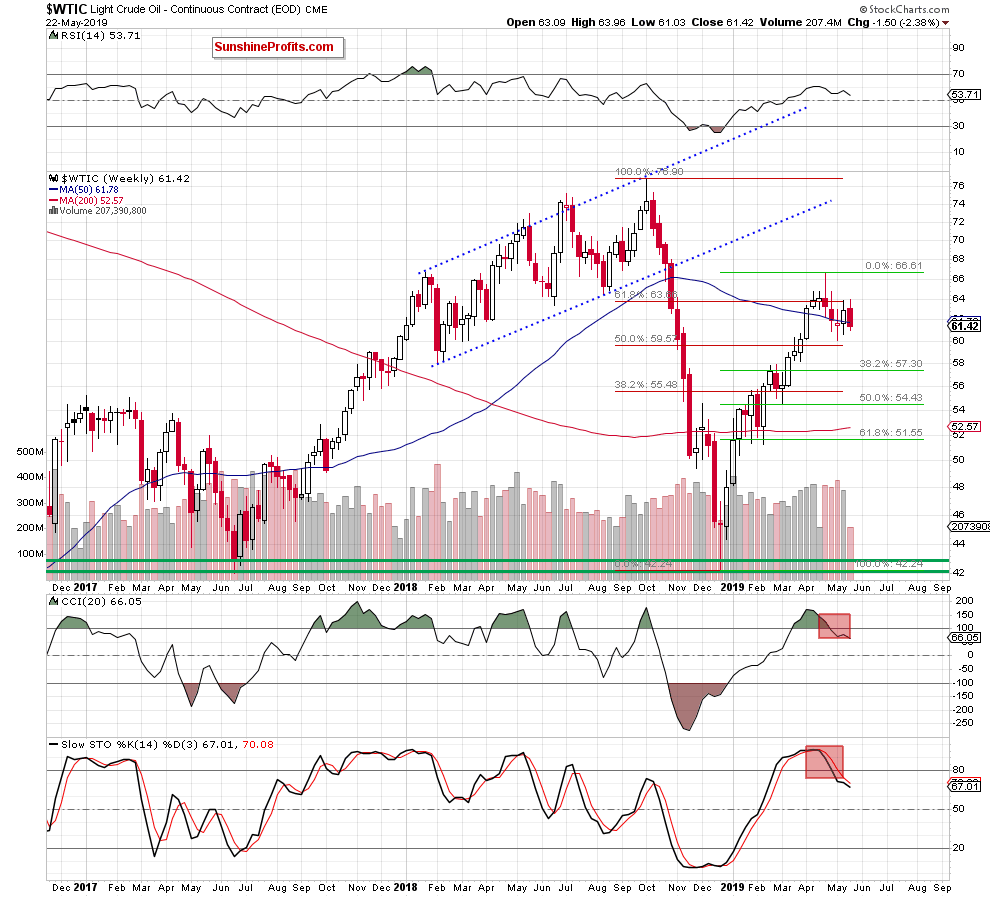
The weekly chart shows that although crude oil moved higher earlier this week, the previously-broken 61.8% Fibonacci retracement stopped the buyers. Just like it had stopped them last week too.
Black gold has pulled back and slipped below the 50-week moving average. This could trigger further deterioration in the following days or even weeks. It's especially so when we factor in the sell signals of the weekly indicators.
The week is however far from being over. As a result, the above bearish scenario will turn actionable only if we see a weekly close below this support.
Let's turn to the daily chart to assess the short-term picture.
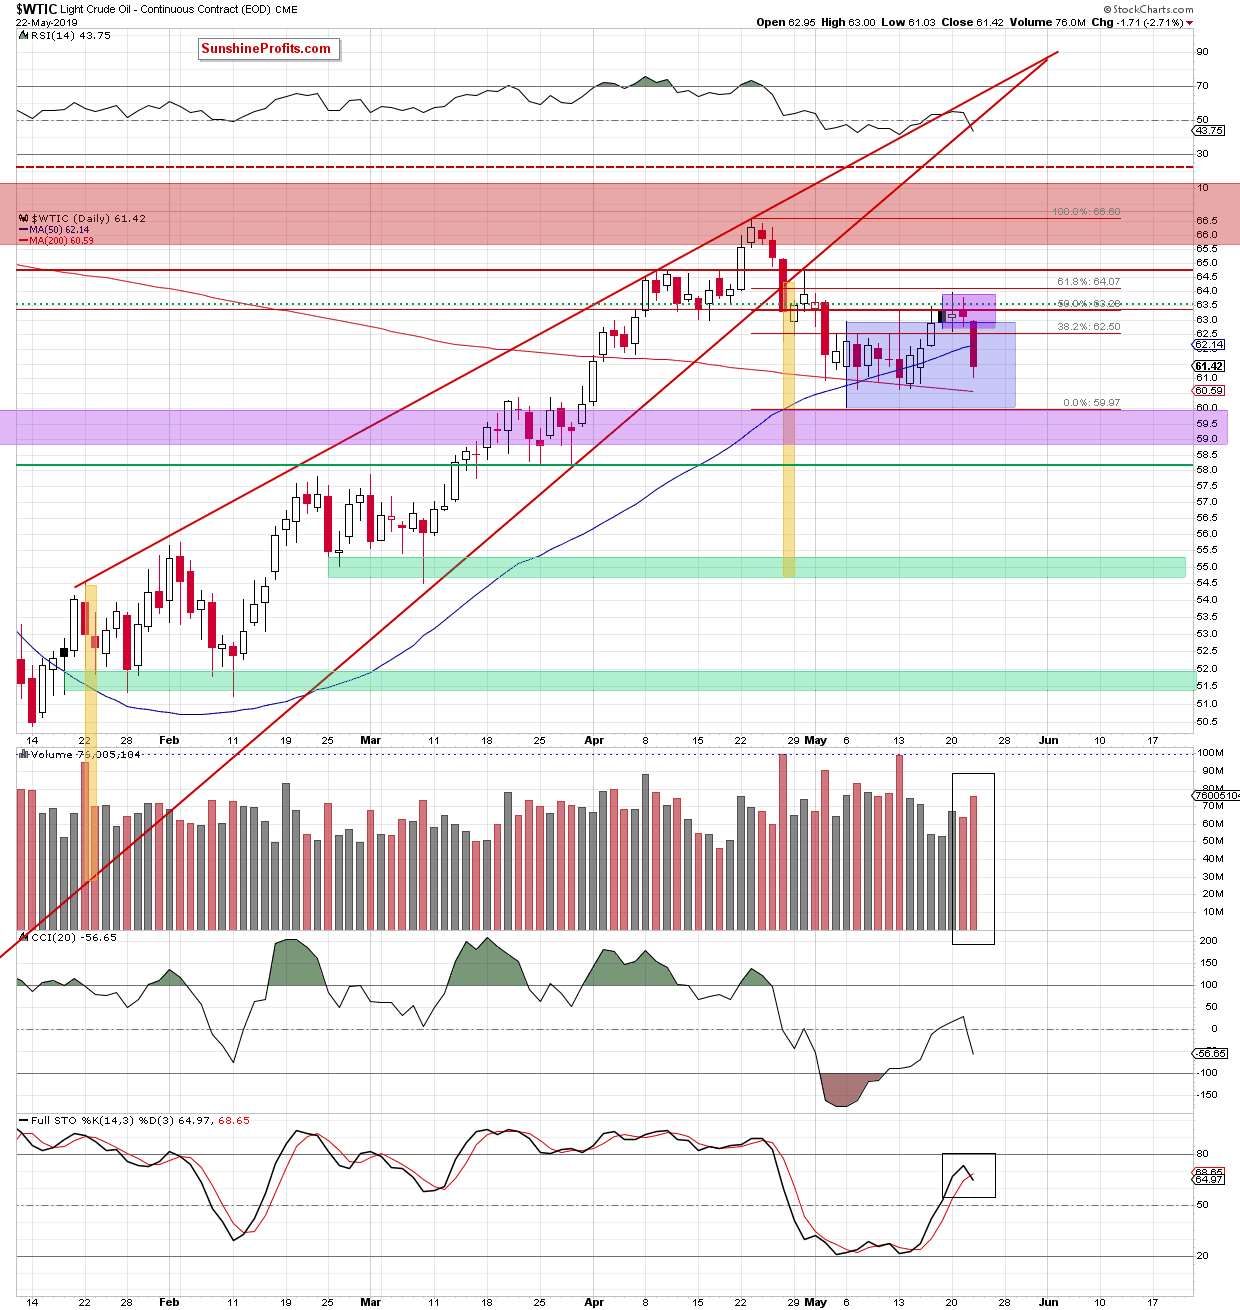
In many previous Alerts, we have mentioned that the oil bulls were visibly having problems overcoming the previously-broken red horizontal line. This resistance is marked by the mid-April lows. Neither have the bulls been able to break above the 50% Fibonacci retracement. This dynamic was confirmed by the declining volume during last week's daily upswings. Yesterday's session revealed the internal weakness of the bull.
Light crude not only declined below the previously-broken upper border of the blue consolidation, but also closed the day below the 50-day moving average. This doesn't bode well for higher prices ahead.
Let's examine the volume and the story it tells. Wednesday's downswing materialized on visibly higher volume than all the preceding upswing days. This points to increasing participation of the sellers and their willingness to push prices even lower. Additionally, the Stochastic Oscillator's previous buy signal just turned into a sell signal.
These are negative developments for the bulls. They hint at further deterioration in the coming days. How low could crude oil go?
The first downside target for the sellers will be the lower border of the blue consolidation (at around $60). That is below the 200-day moving average and quite close to where oil trades right now (it's at around $60.30 currently). Should the bears succeed in getting a daily close below the blue consolidation in the coming days, the probability of testing the late-March lows will increase significantly.
Summing up, the outlook for oil is bearish. The bulls were unable to overcome the previously-broken red horizontal line and the 50% Fibonacci retracement several days in a row, and yesterday's session revealed their weakness. Oil prices have plunged and continue to do so also today. The weekly indicators continue to support lower prices and both the daily volume examination and the daily Stochastic Oscillator concur. The short position continues to be justified.
Trading position (short-term; our opinion): Profitable short position with a stop-loss order at $68.54 and the initial downside target at $58.71 is justified from the risk/reward perspective.
Thank you.
Nadia Simmons
Forex & Oil Trading Strategist

