

Please note that due to market volatility, some of the key levels may have already been reached and scenarios played out.
Trading positions
- Crude Oil [CLX21] We project the $72.65-73.03 area as new support onto which prices could rebound, so we would go long after a dip around that area with a stop just below $69.39 and with a target around $80 (see on Figure 3) – Updated trade position;
- Natural Gas [NGX21] Long around $5.480-5.568 with an initial stop below $4.766 (previous swing low) and targets at $6.63 (TP1) and $7.79 (TP2) – Entry triggered!
Regarding our trade position on natural gas, Friday offered a new opportunity to enter on the same $5.480-5.568 support level (represented by the yellow rectangle on Figure 1 and Figure 2).
[Risk management: our stop loss could potentially be lifted just below the $5.341 swing low]
To visualize the price action better around that support level, let’s zoom into the 4-hour chart:
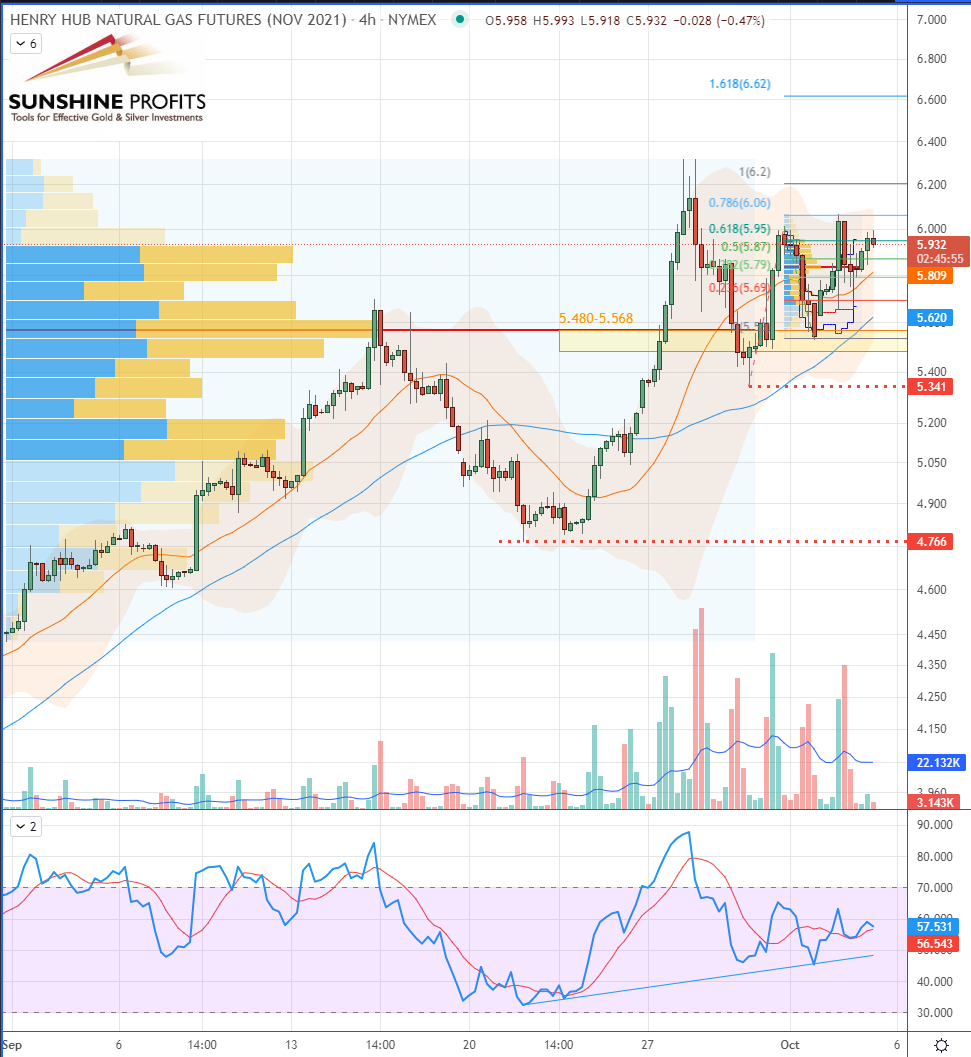
Figure 1 – Henry Hub Natural Gas (NGX21) Futures (November contract, 4H chart, logarithmic scale)
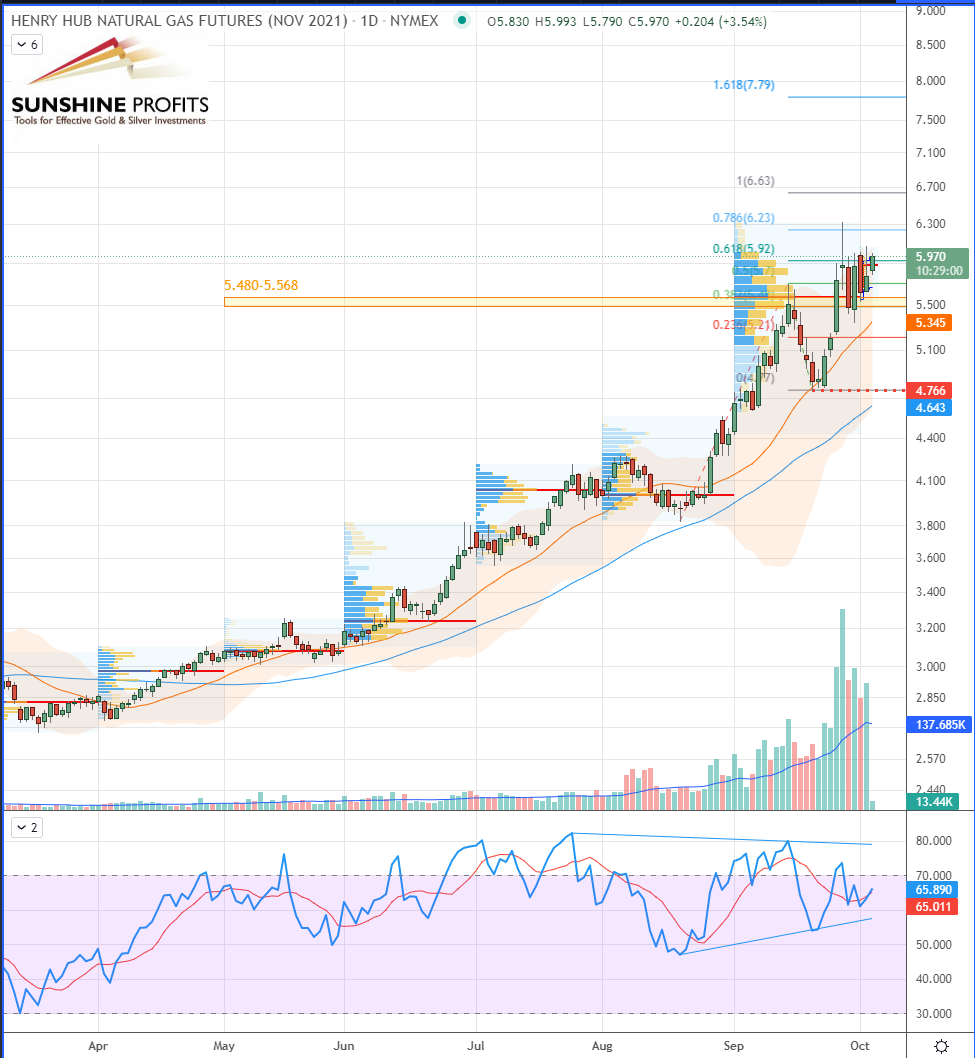
Figure 2 – Henry Hub Natural Gas (NGX21) Futures (November contract, daily chart, logarithmic scale)
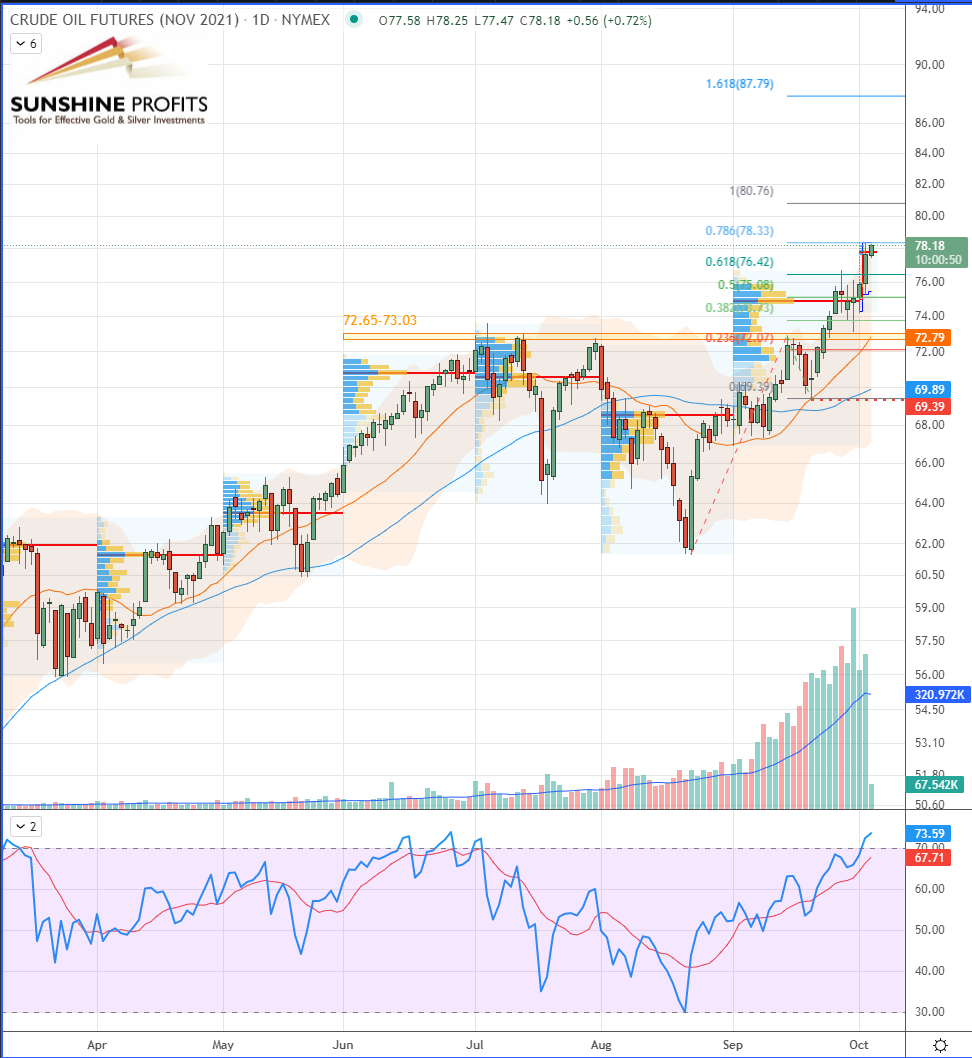
Figure 3 – WTI Crude Oil (CLX21) Futures (November contract, daily chart, logarithmic scale)
Market Analysis
OPEC+ is not adjusting its (perhaps too gradual) uplift in supply, sending the WTI to its highest since 2014 (and for Brent since 2018).
The surge in oil and gas prices threatens to extend the rise in energy prices in general, and consequently to worsen the levels of inflation observed in the United States and Europe. Thus, central banks are under further pressure to tighten their monetary policies quickly. This galloping inflation also frightens the tech sector, whose cash needs are very important. Regarding natural gas, the onset of winter with colder temperatures could further accelerate the shift in demand from gas to oil.

In short, since energy is the heart of the global economy, if inflationary prices are accelerating further, they could lead to a global state of tachycardia, which would rapidly spread to other sectors and, consequently, threaten the entire economy…
As always, we’ll keep you, our subscribers well informed.
Please note that due to market volatility, some of the key levels may have already been reached and scenarios played out.
Trading positions
- Crude Oil [CLX21] We project the $72.65-73.03 area as new support onto which prices could rebound, so we would go long after a dip around that area with a stop just below $69.39 and with a target around $80 (see on Figure 3) – Updated trade position;
- Natural Gas [NGX21] Long around $5.480-5.568 with an initial stop below $4.766 (previous swing low) and targets at $6.63 (TP1) and $7.79 (TP2) – Entry triggered!
Regarding our trade position on natural gas, Friday offered a new opportunity to enter on the same $5.480-5.568 support level (represented by the yellow rectangle on Figure 1 and Figure 2).
[Risk management: our stop loss could potentially be lifted just below the $5.341 swing low]
Thank you.
Sebastien Bischeri
Oil & Gas Trading Strategist

