
Trading position (short-term; our opinion): Short. Stop-loss orders for crude oil and also for WTI Crude Oil (CFD): $102.95.
On Monday, crude oil lost 0.33% on expectations that the reopening of two export terminals in Libya would increase the global supply of light crude. Thanks to this news, crude oil slipped below important support levels, but then reversed. Did this sharp moves change anything in the short-term outlook? We invite you to read our today's Oil Trading Alert.
Yesterday, crude oil moved lower as the Libyan government and rebels reached an agreement to reopen two blocked oil ports, which together normally export 200,000 barrels of crude oil a day (most of it to Europe). Despite this bearish news, the price fluctuated between small gains and losses throughout the day as oil investors wondered whether the deal would succeed. As a reminder, protestors have blocked oil export terminals in Eastern Libya since last summer. However, some Libyan oil production has restarted in recent months only to be halted again amid renewed unrest. Taking the above into account, although the weekend agreement is the first step in returning Libyan oil production and exports to more normal levels, it’s hard to predict what impact will it have on the price of light crude oil in the coming days. Therefore, it seems that the U.S. Energy Information Administration, the International Energy Agency and the Organization of the Petroleum Exporting Countries monthly reports on the global oil market (which will indicate updated expectations for global supply and demand this year), the FOMC Meeting Minutes and U.S. crude and distillates stockpile data from the EIA will be the main factors that affect the price of crude oil in the following days.
Having discussed the above, let’s move on to the technical changes in the crude oil market (charts courtesy of http://stockcharts.com.)
In our last Oil Trading Alert, we wrote the following:
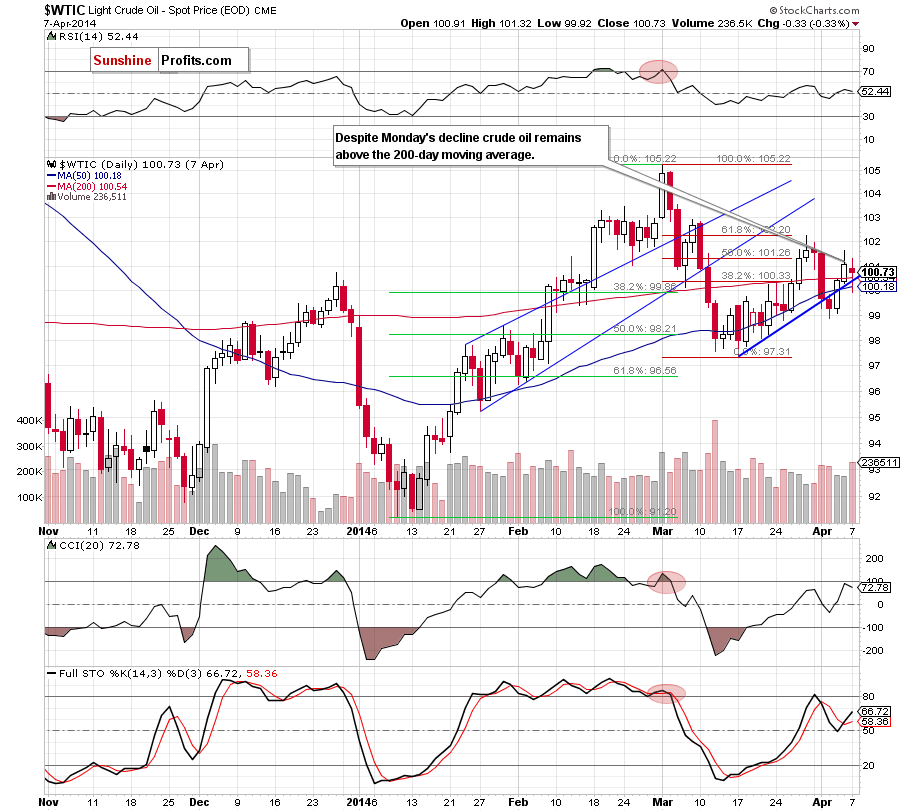
(…) if the resistance zone created by the March 28 and April 1 highs encourages sellers to act, we will likely see another test of the strength of the blue support line.
Yesterday, after the market open, oil bears not only pushed crude oil below this support line, but also below the 200-day and 50-day moving averages. Nevertheless, as you see on the daily chart, this deterioration was only temporarily. The price reversed and came back above these important support levels in the following hours. On one hand, invalidation of a breakdown is a bullish sign, which suggests that we should see further improvement. On the other hand, yesterday’s downswing materialized on relative large volume, which suggests that the sellers are still stronger than the buyers. Therefore, if oil bears show their strength once again, we will likely see another attempt to break below the support zone (around $100.18-$100.54) created by the 200-day and 50-day moving averages and the blue support line. However, if crude oil breaks above the nearest resistance zone, we may see an increase to $102.91, where the March 7 high is.
Having discussed the current situation in light crude, let’s take a look at WTI Crude Oil (theCFD).
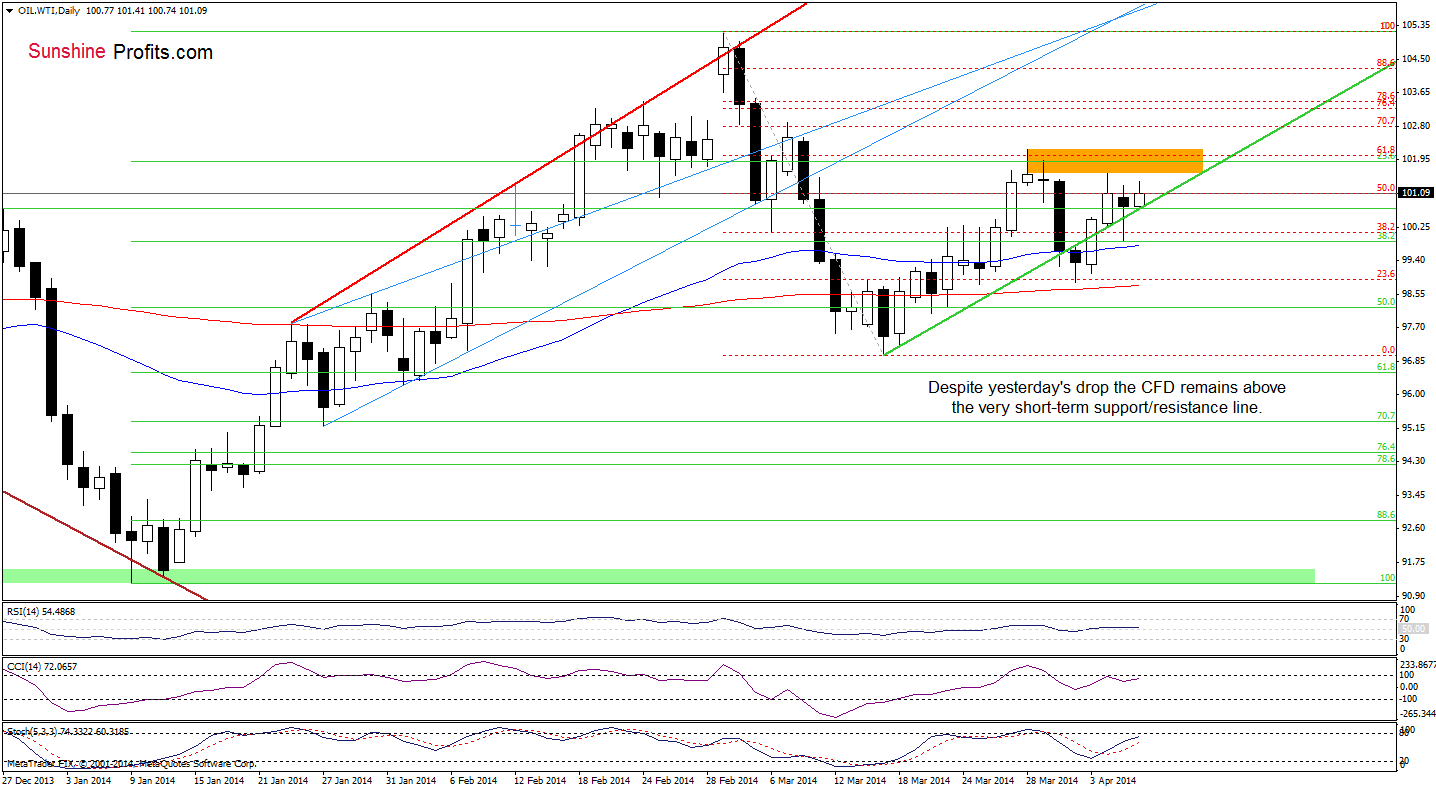
Looking at the above chart, we see that WTI Crude Oil dropped below the green support line, approaching the previously-broken 50-day moving average. As you see on the daily chart, the proximity to this support encouraged oil bulls to act and triggered a corrective upswing. With this move, the CFD invalidated a breakdown, which was a strong positive signal. Nevertheless, although WTI Crude Oil extended gains earlier today, the price still remains below a resistance zone created by the recent highs. If it is broken, we will likely see an increase to around $102.74, where the 70.7% Fibonacci retracement (based on the entire March decline) is. However, if it holds, we may see another attempt to break below the green support line and a pullback to the 50-day moving average.
Which scenario is more likely? Will the 4-hour chart give us any interesting clues? Let’s find out.
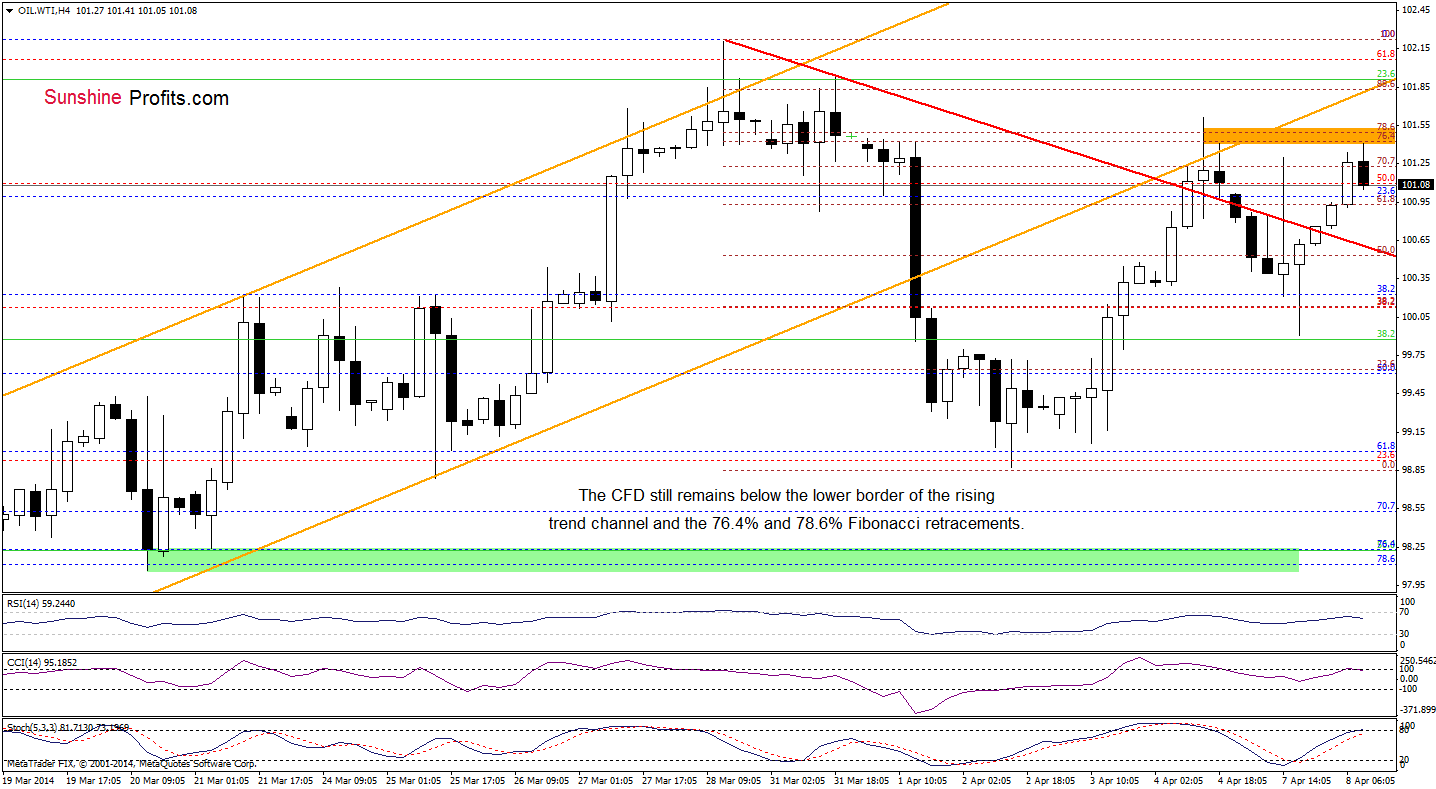
From this perspective, we see that the lower border of the rising trend channel (currently around $101.80) still holds and supports sellers. Additionally, there is also a resistance zone created by the 76.4% and 78.6% Fibonacci retracements (based on the entire recent decline), which stopped further improvement earlier today. Connecting the dots, it seems that as long as WTI Crude Oil remains below this resistance area the space for growth is limited.
Summing up, the short-term situation hasn’t changed much as crude oil remains between the resistance zone (created by the March 28 and April 1 highs) and strong support area (created by the 200-day and 50-day moving averages and the blue support line). From today’s point of view, it seems that only a breakout above the resistance (or breakdown below the support) will trigger a bigger upward (or downward) move. Nevertheless, we should keep in mind that the recent downswings (in the previous week and also at the beginning of March) materialized on an increasing volume, which suggests that the sellers are stronger than the buyers and another decline should not surprise us.
Very short-term outlook: mixed
Short-term outlook: mixed
MT outlook: mixed
LT outlook: mixed
Trading position (short-term): Short. Stop-loss orders for crude oil and also for WTI Crude Oil (CFD): $102.95. We will keep you informed should anything change, or should we see a confirmation/invalidation of the above.
Thank you.
Nadia Simmons
Forex & Oil Trading Strategist
Forex Trading Alerts
Oil Investment Updates
Oil Trading Alerts

