
Trading position (short-term; our opinion): Speculative short positions in crude oil seem to be justified from the risk/reward perspective.
On Thursday, crude oil slipped from a three-week high and lost 0.50% as weak U.S. and global economic numbers pushed the price lower. As a result, light crude closed the day below $102, stepping back from the resistance zone. Does it mean that the recent rally in crude oil running out of steam?
Yesterday, the International Energy Agency raised its forecast of global oil demand for 2014 by 65,000 barrels a day, citing stronger consumption in the U.S. and upward revisions in Japan, Germany and the U.K. The agency now expects global oil demand to average 92.8 million barrels a day this year. Additionally, a flurry of positive economic data in the U.S. supported the price as well.
The U.S. Department of Labor showed in its report that initial claims for jobless benefits in the week ending May 10 fell by 24,000, while analysts had expected jobless claims to fall by 1,000 last week. Elsewhere, the New York Fed said its manufacturing index increased to its highest level since over two years. On top of that, the Bureau of Labor Statistics reported that the U.S. CPI rose to 0.3% in April from 0.2% in March, while the U.S. core CPI (without food and energy items) rose by 0.2% last month (above expectations for 0.1% uptick).
Although the IEA forecast and the above-mentioned numbers were a positive signal, other fundamental factors pressured the price of light crude lower. The Federal Reserve Bank of Philadelphia said its manufacturing index moved down to 15.4 this month from 16.6 in April. Additionally, U.S. industrial production dropped 0.6% last month (confounding expectations for a 0.1% rise) and U.S consumer inflation rates came in better than expected as well. Meanwhile, first-quarter economic growth in the euro zone was reported at 0.2%, below analyst expectations of 0.4%, sending a negative signal for oil demand. Therefore, despite initial increases, crude oil reversed and extended declines as investors digested the numbers.
Once we know major fundamental factors that affected the commodity on Friday, let’s find out what impact did they have on the technical picture of crude oil (charts courtesy of http://stockcharts.com).
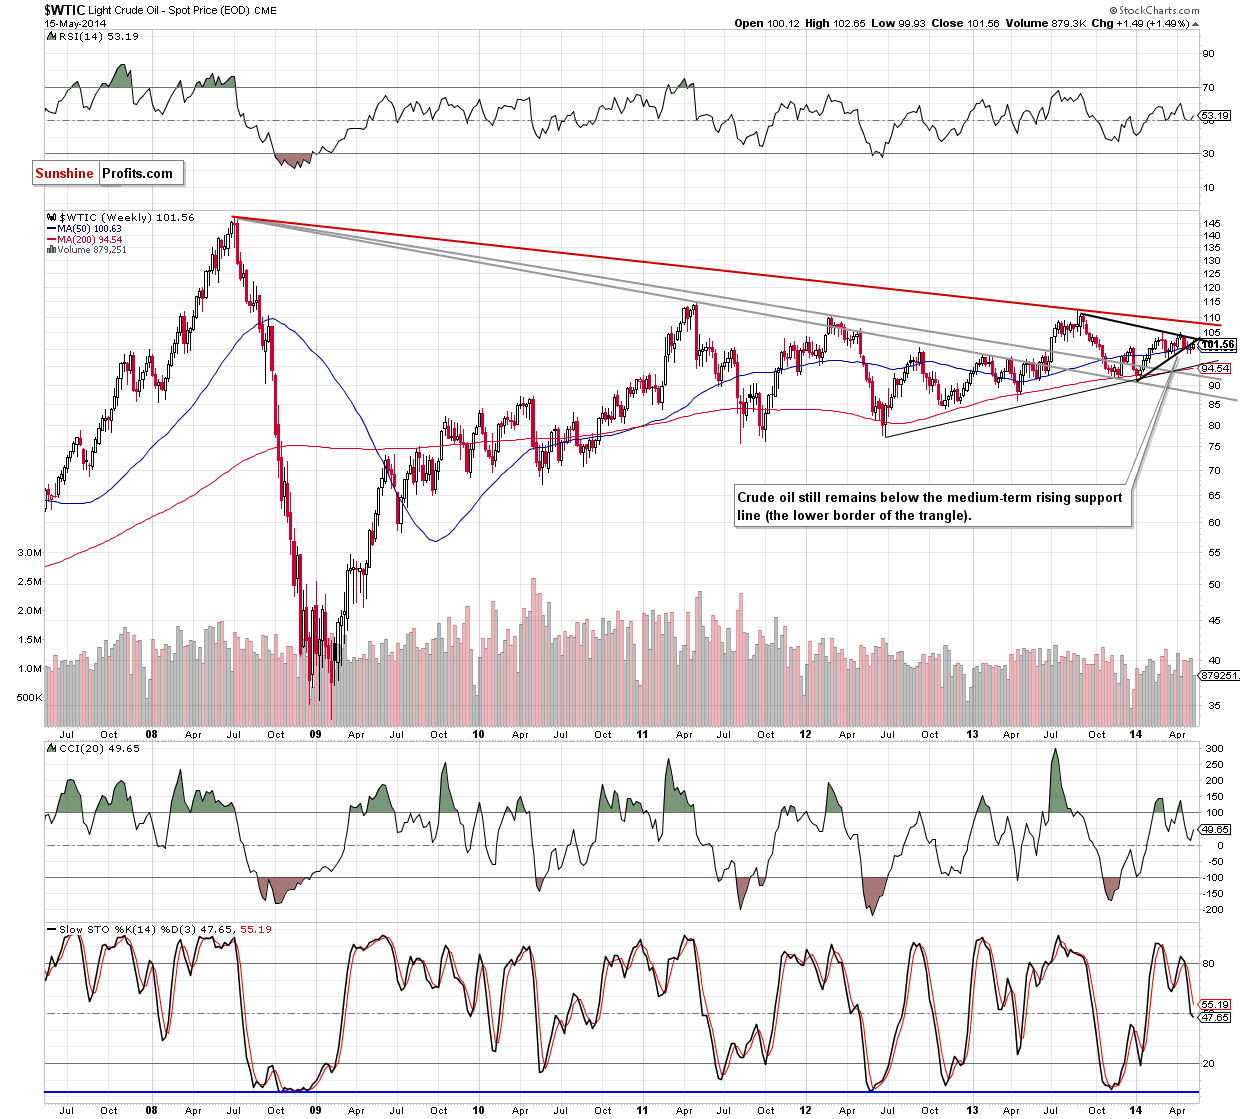
From the weekly perspective, the situation remains unchanged as crude oil is still trading below both medium-term resistance lines. Therefore, what we wrote yesterday is up-to-date:
(…) we remain convinced that as long as this strong resisrance line remains in play further deterioration is still likely. (…) from this perspective, the recent upward move seems to be nothing more than a veryfication of the breakdown. If this is the case, the bearish scenario (…) will be in play:
(…) if the commodity extends losses (…), we will likely see further deterioration and a drop even to around $95, where the medium-term support line (based on the June 2012 and January 2014 lows) is.
What can we infer from the short-term chart?
Quoting our last Oil Trading Alert:
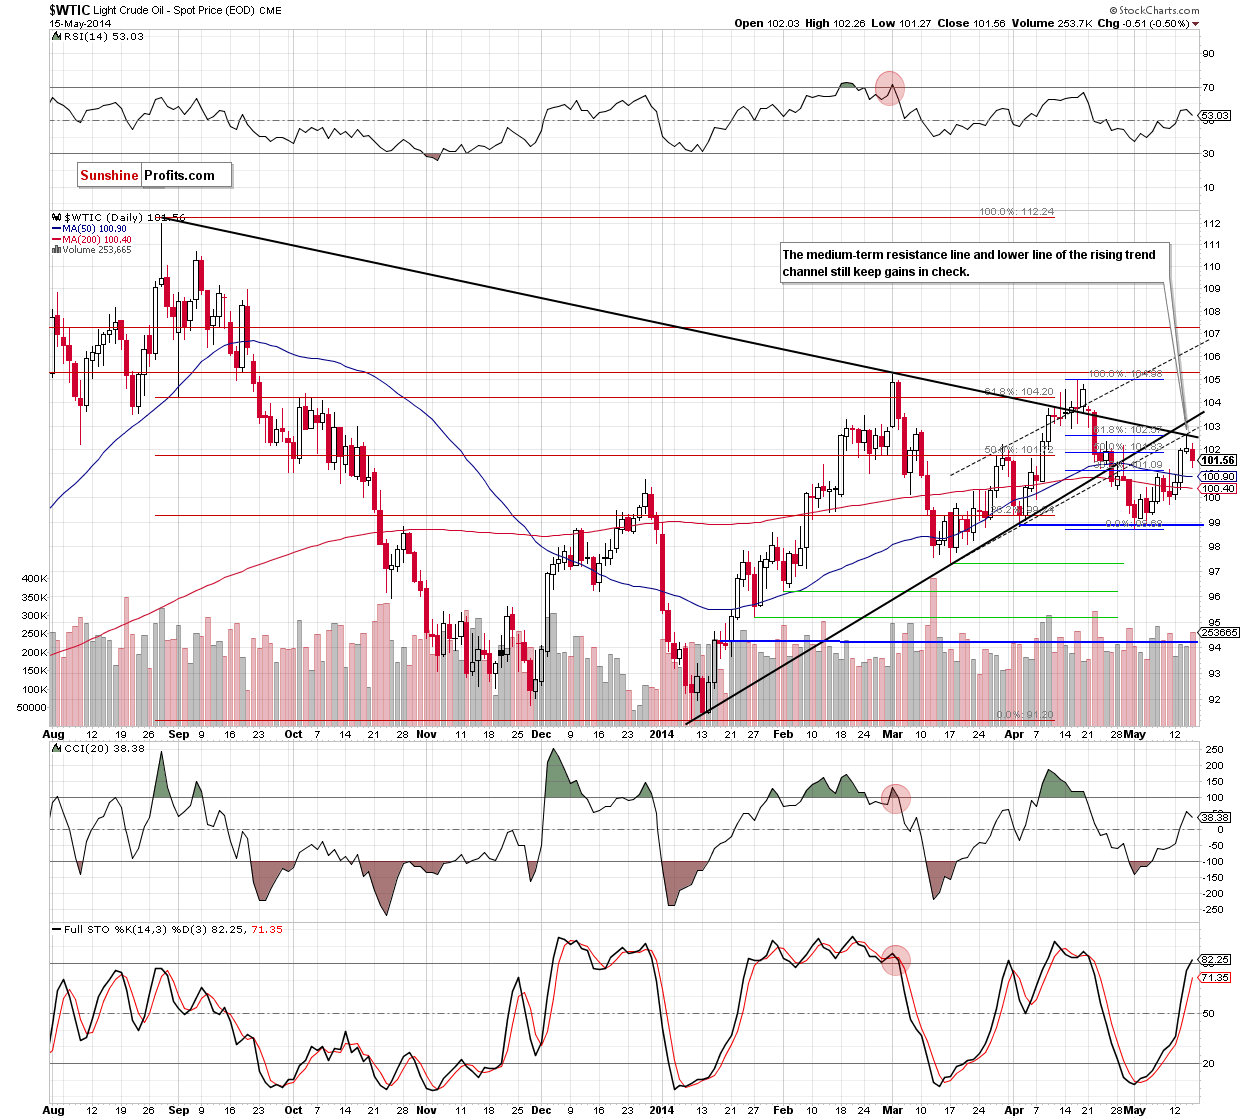
(…) the strong resistance zone (created by both medium-term black lines, the lower border of the rising trend channel and the 61.8% Fibonacci retracement) succesfully stopped further improvement and triggered a downswing (…) yesterday’s candletick has an elongate upper shadow, which indicates that selling pressure overwhelmed buying pressure. From our experience, such situation suggests that oil bears will continue to push the price lower as we saw similar price actions on Aug. 28, Apr. 16 and Apr. 29.
Yesterday, we noticed such price action as crude oil reversed after the market’s open. According to our assumptions, the commodity declined and closed the day below $102. Additionally, yesterday’s downswing materialized on relative large volume (compared to the previous days), which confirms that oil bears are getting stronger. What does it mean for crude oil? If light crude extends losses (which is more likely than not), this will mean that the recent rally was nothing more than a verification of the breakdown below major resistance lines. Just like we wrote yesterday, we believe that would happen in the coming days and the first downside target would be the previously-broken 50-day moving average (currently around $100.90).
Summing up, we remain convinced that lower values of crude oil are still ahead us. From today’s point of view, it seems quite likely that the recent rally was nothing more than a verification of the breakdown below 2 medium-term black lines and the lower border of the rising trend channel. If this is the case, it would be a strong bearish signal that would trigger further deterioration.
Very short-term outlook: bearish
Short-term outlook: bearish
MT outlook: mixed
LT outlook: mixed
Trading position (short-term): Short. Stop-loss order: $104. We will keep you informed should anything change, or should we see a confirmation/invalidation of the above.
Thank you.
Nadia Simmons
Forex & Oil Trading Strategist
Przemyslaw Radomski, CFA
Founder, Editor-in-chief
Gold & Silver Trading Alerts
Forex Trading Alerts
Oil Investment Updates
Oil Trading Alerts

