
Trading position (short-term; our opinion): No positions are justified from the risk/reward perspective.
On Monday, crude oil lost 2.50% as worries over a global supply glut outweighed news from Libya where battling militias have closed ports. In these circumstances, light crude hit a fresh 2014 low and closed at its lowest level since May 2009. How low could the commodity go?
Although news of further damage of Libya's oil infrastructure supported the price after the market’s open, all gains were quickly erased as ongoing fears of global oversupply overshadowed concerns about output from the OPEC producer. Additionally, data from oil services firm Baker Hughes Inc showed that although the number of rigs drilling for oil in the United States dipped in the latest week, the count for U.S. oil rigs remained up from a year ago, indicating that production would remain robust. In this environment, crude oil extended losses and dropped to an intraday low of $52.90. Will we see a test of technical support at $50 per barrel? (charts courtesy of http://stockcharts.com).
In our previous Oil Trading Alert, we wrote the following:
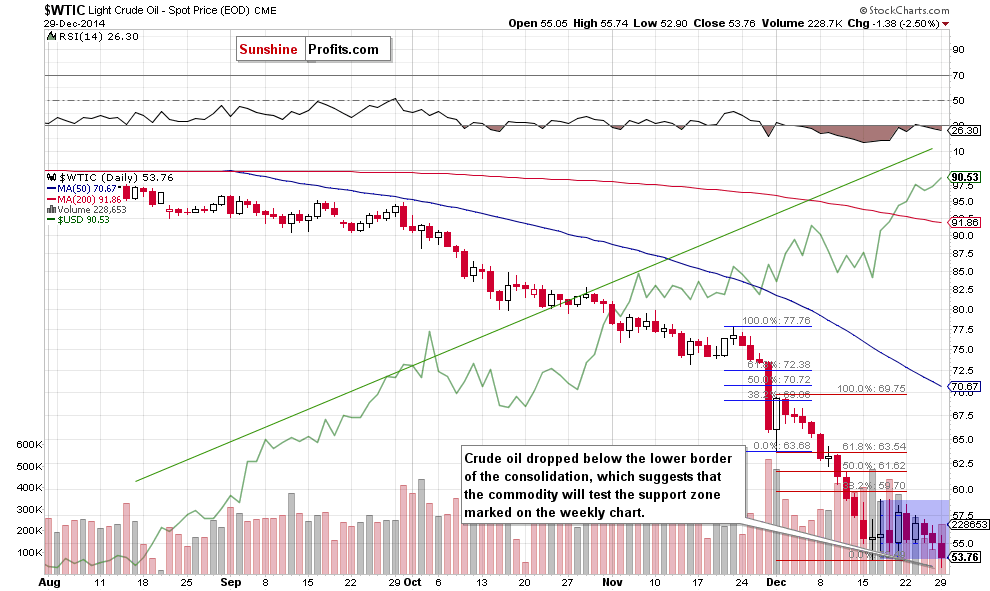
(…) When we take a closer look at the daily chart, we see that there was a bigger and sharp corrective upswing at the beginning of the month. Back then, although crude oil corrected over 38.2% of earlier downward move, oil bulls didn’t manage to push the commodity higher, which translated to a fresh 2014 low.
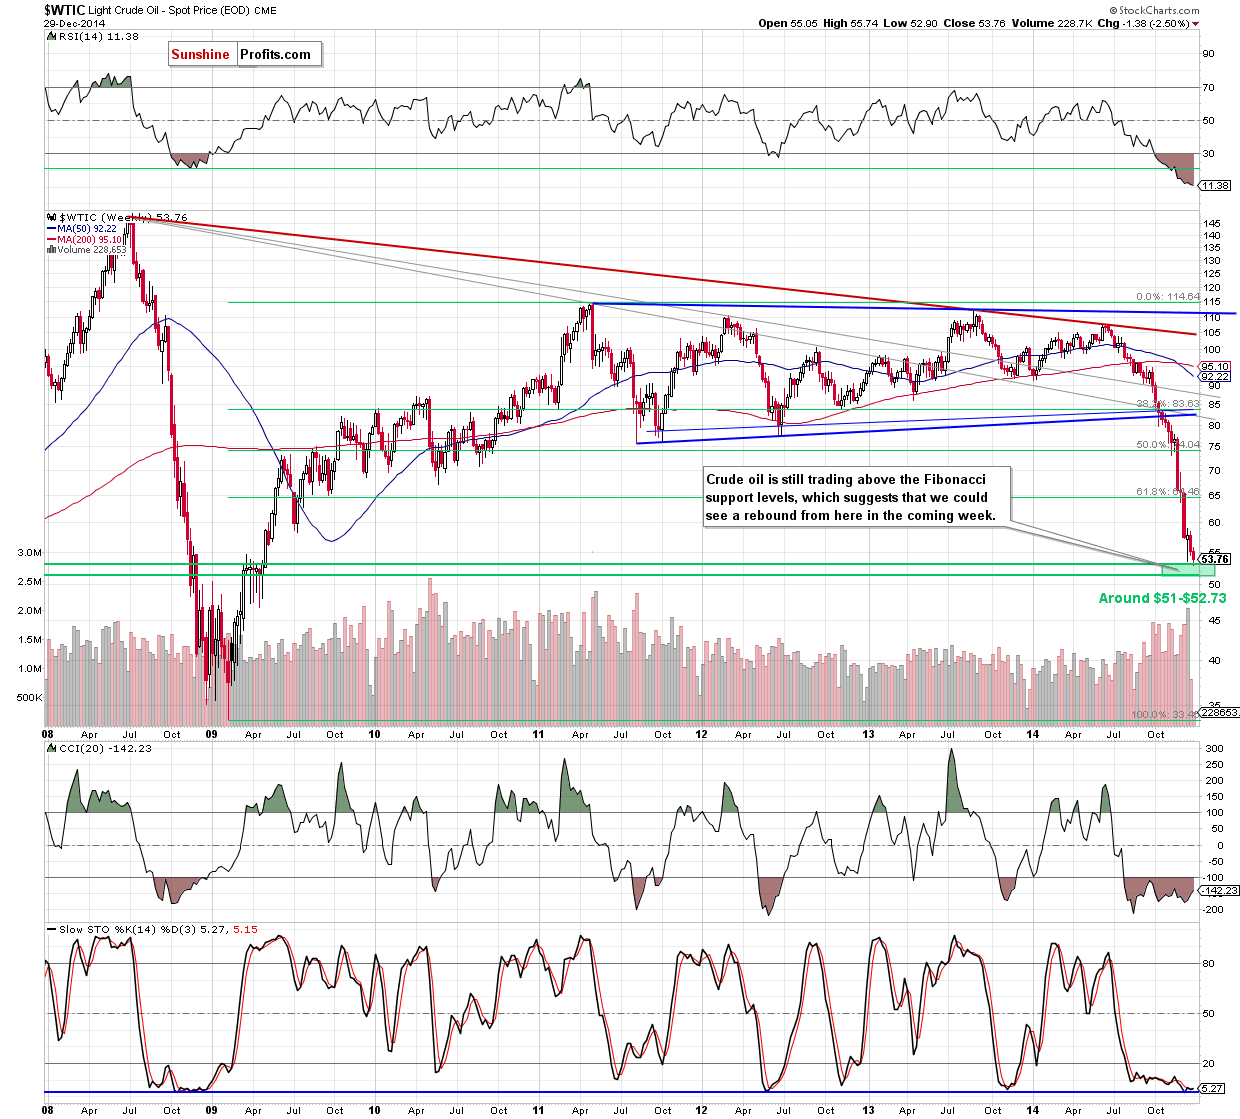
Looking at the daily chart, we see that history repeated itself and after several days in the consolidation crude oil broke below the lower border of the formation (marked with blue) – similarly to what we saw at the beginning of the month. Taking this fact into account, and combining it with an invalidation of the positive impact of doji candlestick formations, we think that lower values of the commodity are still ahead us. If this is the case, we’ll see a test of the support zone created by the 76.4% and 78.6% Fibonacci retracement levels (around $51-$52.73) in the coming day (or days).
Summing up, crude oil declined once again and broke below the lower border of the consolidation, which suggests further deterioration and a test of the support zone around $51-$52.73. Taking into account the fact that the space for declines seems limited, opening short positions at these levels is not justified from the risk/reward perspective.
Very short-term outlook: bearish
Short-term outlook: mixed
MT outlook: mixed
LT outlook: bullish
Trading position (short-term; our opinion): No positions are justified from the risk/reward perspective at the moment, but we will keep you informed should anything change.
Thank you.
Nadia Simmons
Forex & Oil Trading Strategist
Przemyslaw Radomski, CFA
Founder, Editor-in-chief
Gold & Silver Trading Alerts
Forex Trading Alerts
Oil Investment Updates
Oil Trading Alerts

