

Trading position (short-term; our opinion): Short positions (with a stop-loss order at $56.45 and an initial downside target at $45.81) are justified from the risk/reward perspective.
On Wednesday, crude oil lost 3.78% after the EIA weekly report showed an unexpected build in U.S. gasoline inventories. Thanks to this drop light crude invalidated the earlier breakouts above the resistance lines and approached the level of $50. Will we see lower prices in the coming days?
Although yesterday’s U.S. Energy Information Administration’s weekly report showed that Supplies at Cushing, Oklahoma dropped by 778,000 barrels last week and distillate inventories decreased by 2.0 million barrels, the report also showed that crude oil inventories dropped by 1.0 million barrels in the week ended April 14, missing analysts' expectations of a 1.4 million barrels decline. On top of that, gasoline inventories increased by 1.5 million barrels, compared to expectations for a drop 1.9 million barrels, which disappointed market participants and encouraged oil bears to act. Will we see lower prices in the coming days?
Let’s examine the charts below (charts courtesy of http://stockcharts.com).
On Monday, we wrote the following:
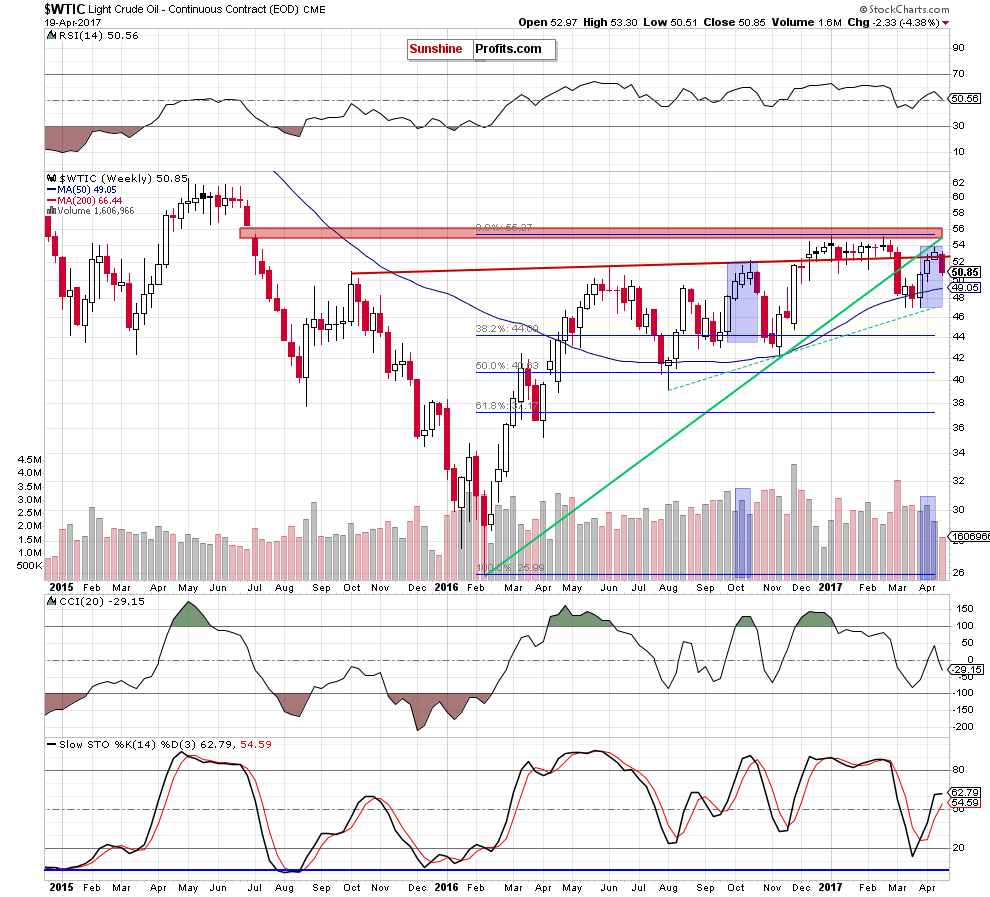
(…) although crude oil moved a bit higher in the previous week, the commodity is still trading under the long-term rising resistance line based on the February and November lows, which suggests that the recent increases could be nothing more than a verification of the earlier breakdown and as long as there is no invalidation of the breakdown reversal and lower prices are more likely than not.
This scenario is also reinforced by the size of the recent candlesticks. As you see on the chart, from week to week, their bodies were getting smaller, suggesting that oil bulls are losing strength. We saw a similar situation in October (we marked both of them with blue). Back then, smaller bodies materialized on decreasing volume preceded a reversal and a bigger decline, which increases the probability that we’ll see a similar situation in the coming weeks.
From today’s point of view, we see that oil bears showed their claws and pushed crude oil sharply lower as we had expected. Thanks to this drop, the commodity came back below the long-term red resistance line, invalidating the earlier breakout.
How did this decline affect the very short-term picture? Let’s examine the daily chart and find out.
Yesterday, we wrote the following:
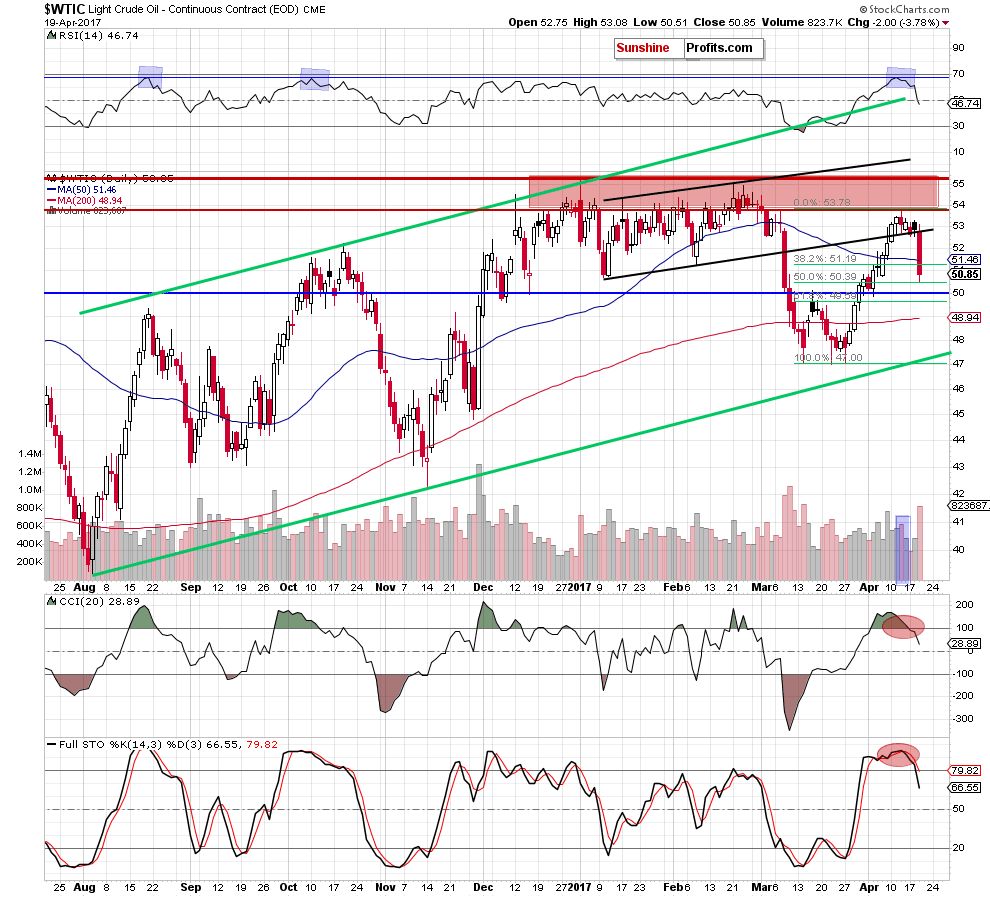
(…) crude (…) moved initially higher and came back above the lower border of the black rising trend channel. Although this is a positive sign, the black gold is still trading under the key resistance zone and the sell signals generated by the daily indicators remain in place, suggesting lower prices in the following days.
Additionally, after yesterday’s market’s closure, the American Petroleum Institute showed that U.S. crude oil inventories dropped less-than-expected (840,000 barrels compared to analyst estimates of a 1.47 million barrels dip) and gasoline stocks increased by 1.4 million barrels. If today’s government data confirms these disappointing numbers, oil bears will receive another reason to act in the following hours.
On Tuesday, we also wrote:
(…) How low could the commodity go in the coming days? In our opinion, the initial downside target will be around $52.16, where the 23.6% Fibonacci retracement based on the entire March-April upward move is. If this support is broken, the next targets for oil bears will be around: $51.18 (the 38.2% retracement), $50.38 (the 50% retracement)
Looking at the daily chart, we see that the situation developed in line with the above scenario and crude oil reversed and declined under the previously-broken lower border of the black rising trend channel, invalidating the earlier tiny breakout. This bearish development triggered a sharp decline, which corrected almost 50% of the March-April upward move. What’s important, yesterday’s move materialized on significant volume, which confirms oil bears’ strength, suggesting further deterioration – especially when we factor in the medium-term picture and the sell signals generated by the daily indicators.
Taking all the above into account, we believe that the commodity will test the barrier of $50 in the coming day(s). If this important support is broken, the next target will be around $49.58, where the 61.8% Fibonacci retracement is.
Summing up, short positions continue to be justified as crude oil invalidated the earlier breakout above the long-term red line and lower border of the black rising trend channel, which could encourage oil bears to act and trigger another downswing in the coming day(s) – similarly to what we saw in the past.
Very short-term outlook: bearish
Short-term outlook: mixed with bearish bias
MT outlook: mixed
LT outlook: mixed
Trading position (short-term; our opinion): Short positions (with a stop-loss order at $56.45 and an initial downside target at $45.81) are justified from the risk/reward perspective. We will keep you informed should anything change, or should we see a confirmation/invalidation of the above.
As a reminder – “initial target price” means exactly that – an “initial” one, it’s not a price level at which we suggest closing positions. If this becomes the case (like it did in the previous trade) we will refer to these levels as levels of exit orders (exactly as we’ve done previously). Stop-loss levels, however, are naturally not “initial”, but something that, in our opinion, might be entered as an order.
Thank you.
Nadia Simmons
Forex & Oil Trading Strategist
Przemyslaw Radomski, CFA
Founder, Editor-in-chief, Gold & Silver Fund Manager
Gold & Silver Trading Alerts
Forex Trading Alerts
Oil Investment Updates
Oil Trading Alerts

