

Trading position (short-term; our opinion): No positions are justified from the risk/reward perspective.
On Wednesday, the black gold gained 0.84% after the EIA weekly report showed that crude oil inventories declined once again. As a result, light crude bounced off the long-term support line and came back to the resistance zone. Will it manage to stop oil bulls in the coming days?
Yesterday, the U.S. Energy Information Administration showed that crude oil inventories dropped by 1.8 million barrels in the week ended May 12. Additionally, the report also showed that gasoline inventories declined by 413,000 barrels and distillate inventories fell by 1.9 million barrels. Thanks to these bullish numbers, light crude bounced off the long-term support line and came back to the resistance zone. Will it manage to stop oil bulls in the coming days?
Let’s take a closer look at the charts and find out (charts courtesy of http://stockcharts.com).

From the weekly perspective, we see that the overall situation hasn’t changed much as crude oil is still trading under the previously-broken 50-week moving average. Nevertheless, the Stochastic Oscillator generated the buy signal, suggesting further improvement.
But will we see such price action? Let’s examine the very short-term picture of the commodity and find out.

On the daily chart, we see that crude oil bounced off the previously-broken long-term green line and climbed to the red resistance zone (marked with the red ellipse).
What’s next for the commodity? We believe that the best answer to this question will be the quote from our previous alert:
(…) On one hand yesterday’s price action could look like a verification of the earlier breakout above the long-term green line. However, on the other hand, the red resistance area continues to keep gains in check. This suggests that as long as there is no breakout above this zone further rally is not likely to be seen and another downswing should not surprise us – especially when we factor in our yesterday’s commentary on the long-term picture of the commodity.
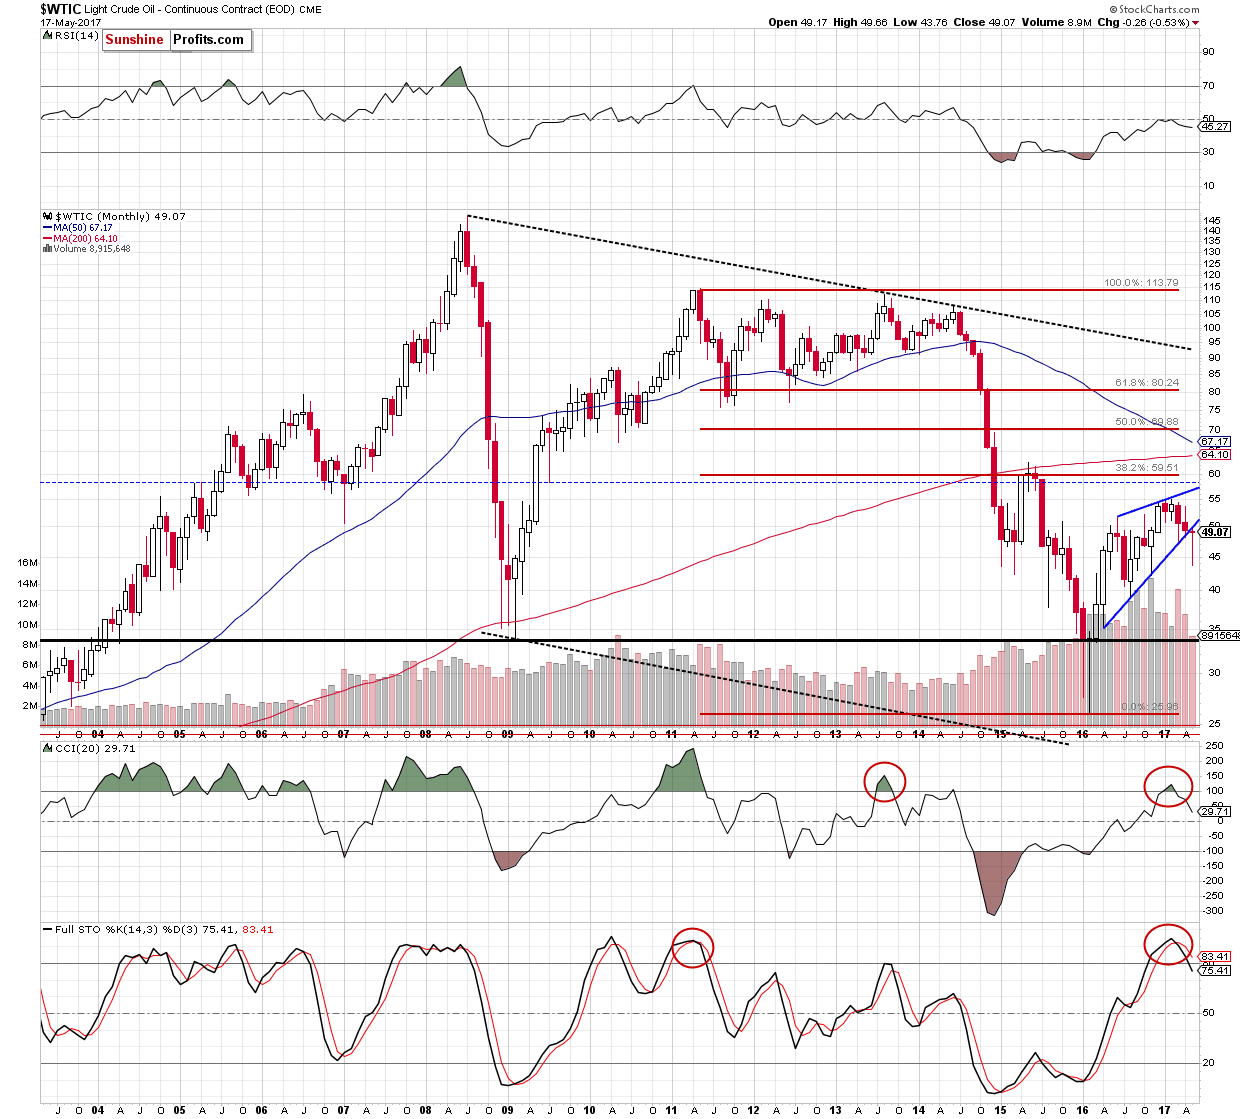
On the monthly chart, we see that the recent upswing approached crude oil to the previously-broken lower border of the blue rising wedge, which looks like a verification of the breakdown. Additionally, the sell signals generated by the long-term indicators remain in play, suggesting that lower prices of the black gold are still ahead us.
Finishing today’s alert, it’s worth keeping in mind that although crude oil and gasoline inventories dropped yesterday, the declines were smaller than forecasts. On top of that, supplies at Cushing, Oklahoma rose by 35,000 barrels last week, which could encourage oil bears to act in the coming day(s).
Summing up, crude oil increased to the red resistance zone once again, which could trigger a pullback later in the day – similarly to what we saw earlier this week. This means that as long as there is no breakout above this zone further rally is not likely to be seen and another downswing should not surprise us.
Very short-term outlook: mixed with bearish bias
Short-term outlook: mixed
MT outlook: mixed
LT outlook: mixed
Trading position (short-term; our opinion): No positions are justified from the risk/reward perspective. We will keep you – our subscribers – informed should anything change.
Thank you.
Nadia Simmons
Forex & Oil Trading Strategist
Przemyslaw Radomski, CFA
Founder, Editor-in-chief, Gold & Silver Fund Manager
Gold & Silver Trading Alerts
Forex Trading Alerts
Oil Investment Updates
Oil Trading Alerts

