

Trading position (short-term; our opinion): Short positions (with a stop-loss order at $56.45 and an initial downside target at $45.81) are justified from the risk/reward perspective.
On Friday, the black gold moved higher as concerns that the conflict in Syria could spread in the oil-rich region weighed on investors’ sentiment. Thanks to these circumstances, light crude increased to the previously-broken important lines. Will we see a verification of breakdowns or further rally? Is it possible that the relationship been crude oil and precious metals give us more clues about future moves?
Let’s examine the charts below (charts courtesy of http://stockcharts.com).

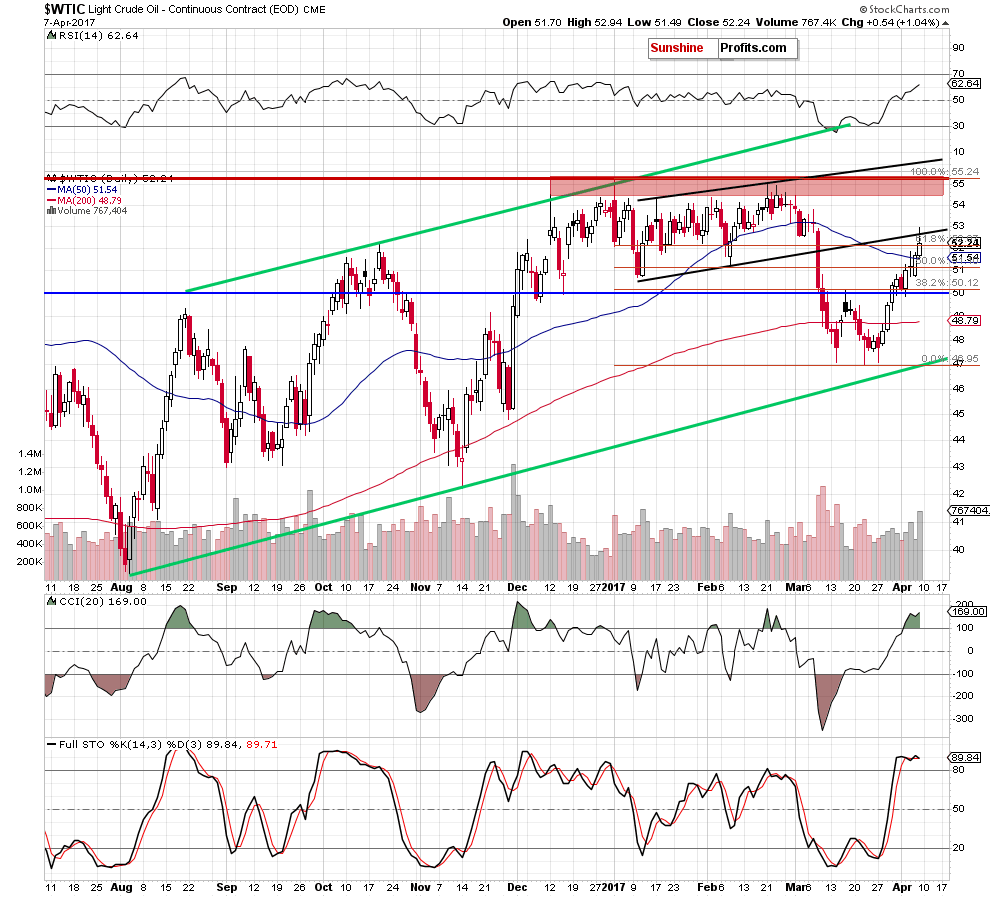
Looking at the weekly chart, we see that the recent upward move took crude oil to the previously-broken red resistance line based on the October 2015, June 2016 and October 2016 peaks. Additionally, light crude almost touched the green resistance line based on the February and November lows, which looks like a verification of the earlier breakdowns.
On top of that, when we take a look at the very short-term chart, we can see additional bearish factors.
Quoting our previous alert:
(…) What’s next? Taking into account the current position of the indicators and the long-term picture (we wrote more about this issue yesterday), we think that even if light crude moves a bit higher and we’ll see a verification of the breakdown under the lower border of the black rising trend channel (currently around $52.60), the next bigger move will be to the downside.
From today’s point of view, we see that the situation developed in line with our assumptions and Friday’s upswing took the black gold to the previously-broken lower border of the black rising trend channel. Despite this increase, oil bulls didn’t manage to push the commodity higher, which resulted in a pullback. Thanks to this drop, light crude slipped under the black resistance line, which looks like a verification of the earlier breakdown and suggests lower prices in the coming week – especially when we factor in the medium-term picture.
Additionally, the CCI and the Stochastic Oscillator remain in their overbought areas, which increases the probability of generating sale signals in the coming day(s).
Are there any other technical factors that could encourage oil bears to act? Let’s take a closer look at the relationship between crude oil and precious metals.
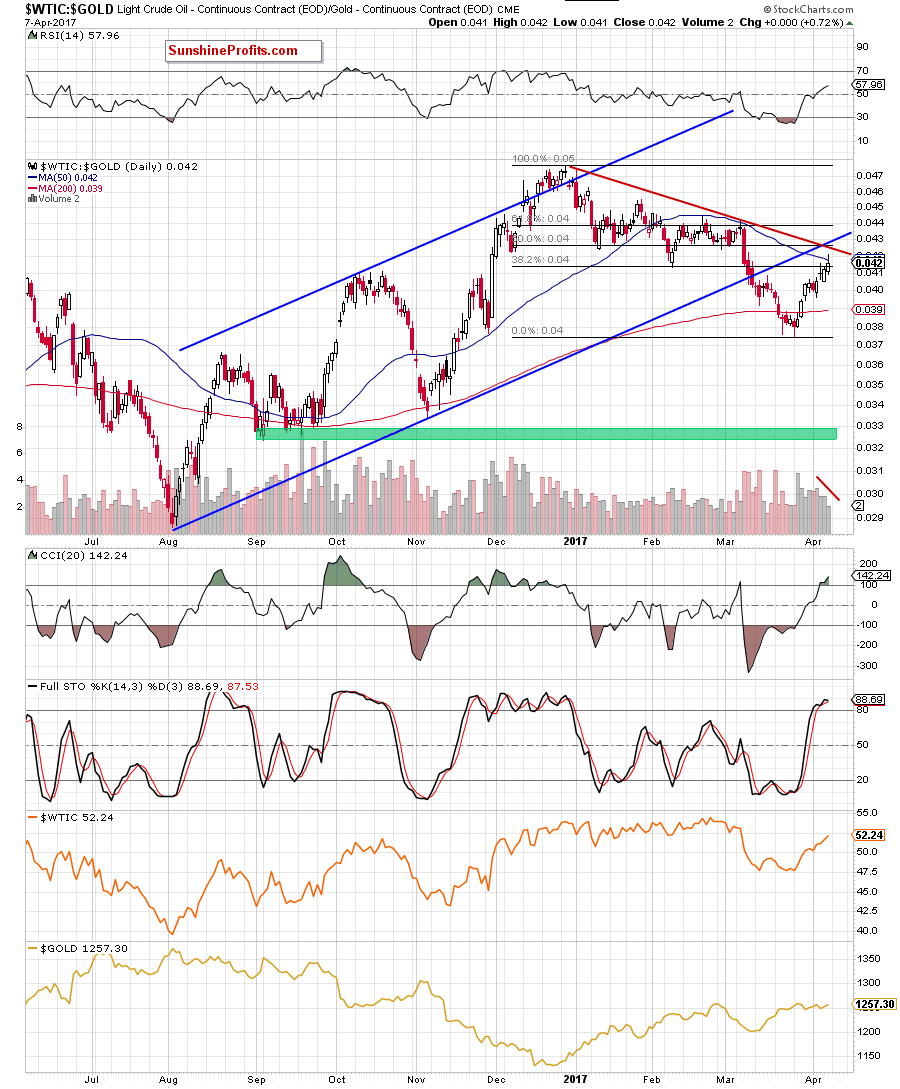
Looking at the above chart, we see that the oil-to-gold ratio extended gains, broke above the 38.2% Fibonacci retracement and climbed slightly above the 50-day moving average. Despite this improvement, the proximity to the red resistance declining line based on the previous highs encouraged oil bears to act, which resulted in a pullback, which pushed the ratio below the previously-broken 50-day moving average. In this way, the ratio invalidated the earlier tiny breakout, which is a negative signal. Additionally, the CCI and the Stochastic Oscillator increased to their overbought levels, which suggests that we can see a reversal in a very near future – especially when we factor in the proximity to the lower border of the blue rising trend channel and decreasing volume during recent increases.
Will the oil-to-silver ratio give us more bearish signs? Let’s check.

From this perspective, we see that the ratio extended gains and reached the solid resistance area (created by the 38.2% Fibonacci retracement based on the entire downward move and the upper border of the red declining trend channel), which could stop further improvement in the coming day(s). Additionally, when we take a closer look at the chart, we clearly see that the recent upward move materialized on decreasing volume, which suggests that oil bulls are getting weaker and reversal is just around the corner.
Summing up, short positions continue to be justified as crude oil verified the earlier breakdown under the long-term red resistance line (based on the October 2015, June 2016 and October 2016 peaks) and the lower border of the black rising trend channel. Additionally, the current situation in the oil-to-gold and oil-to-silver ratios suggests that reversal is just around the corner (this scenario is also reinforced by the current position of the daily indicators).
Very short-term outlook: bearish
Short-term outlook: mixed with bearish bias
MT outlook: mixed
LT outlook: mixed
Trading position (short-term; our opinion): Short positions (with a stop-loss order at $56.45 and an initial downside target at $45.81) are justified from the risk/reward perspective. We will keep you informed should anything change, or should we see a confirmation/invalidation of the above.
Thank you.
Nadia Simmons
Forex & Oil Trading Strategist
Przemyslaw Radomski, CFA
Founder, Editor-in-chief, Gold & Silver Fund Manager
Gold & Silver Trading Alerts
Forex Trading Alerts
Oil Investment Updates
Oil Trading Alerts

