
Trading position (short-term; our opinion): No positions are justified from the risk/reward perspective.
On Monday crude oil declined to its lowest level since Apr.7 as sanctions against Russia and Libya supply prospects weighted on the price. Although the commodity rebounded later in the day, it still remains below the previously-broken important lines. Are they strong enough to trigger further deterioration?
Yesterday, the U.S. froze the assets of seven Russian officials and 17 companies and prohibited the officials from receiving U.S. visas, while the European Union also imposed new sanctions on 15 Russian and Ukrainian individuals. The announcements came as the situation in Ukraine continued to deteriorate. Yesterday, the mayor of Kharkiv, Ukraine's second-largest city after the capital Kiev, was shot by a sniper while jogging and pro-Russian separatists expanded to another eastern city despite Kiev's military campaign to contain them. Although these new sanctions signal the failure of a deal reached April 17 in Geneva (which was designed to de-escalate tensions in eastern Ukraine), they disappointed market participants as were less aggressive than expected. Additionally, major players in the oil market escaped sanctions and the potential for disruption appeared limited. In reaction to this news, crude oil extended losses and approached more closely the psychological barrier of $100.
Also yesterday, the data showed that U.S. pending home sales jumped 3.4% in March, well above expectations for a 1% gain. At this point, it’s worth noting that this was the first increase in nine months. Despite this bullish data, news that one of Libya's oil terminal could resume operations in the near future and Libya's oil shipments would add to already abundant global supplies capped the gains and pushed the price lower.
Having discussed the above, let’s move on to the technical changes in the crude oil market (charts courtesy of http://stockcharts.com.)
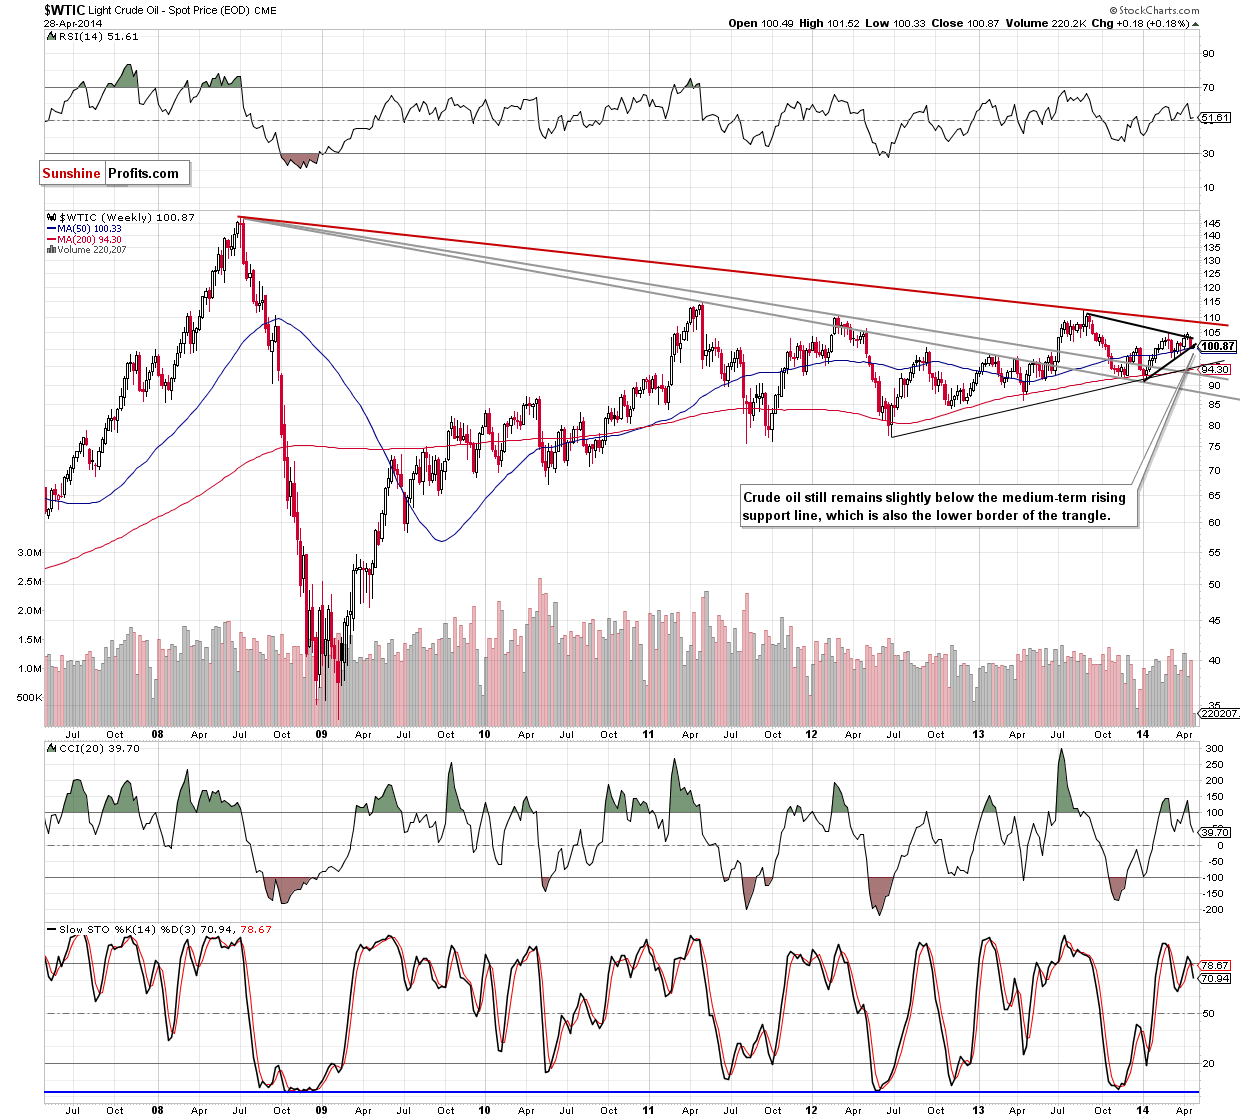
From the weekly perspective, we see that crude oil declined below the lower border of the triangle, which is a bearish signal. On one hand, if the buyers manage to invalidate the breakdown and push the price above the rising black line, we may see a corrective upswing in the following days. In this case, the upside target for the buyers will be the medium-term resistance line (currently around $103.50). However, if oil bears do not give up, we will likely see further deterioration and a drop even to around $95, where the medium-term support line (based on the June 2012 and January 2014 lows) is. At this point, it’s worth noting that the CCI generated a sell signal, while the Stochastic Oscillator is close to doing it, which suggests that another attempt to move lower should not surprise us.
To see the current situation in crude oil more clearly, let’s zoom in on our picture and move on to the daily chart.
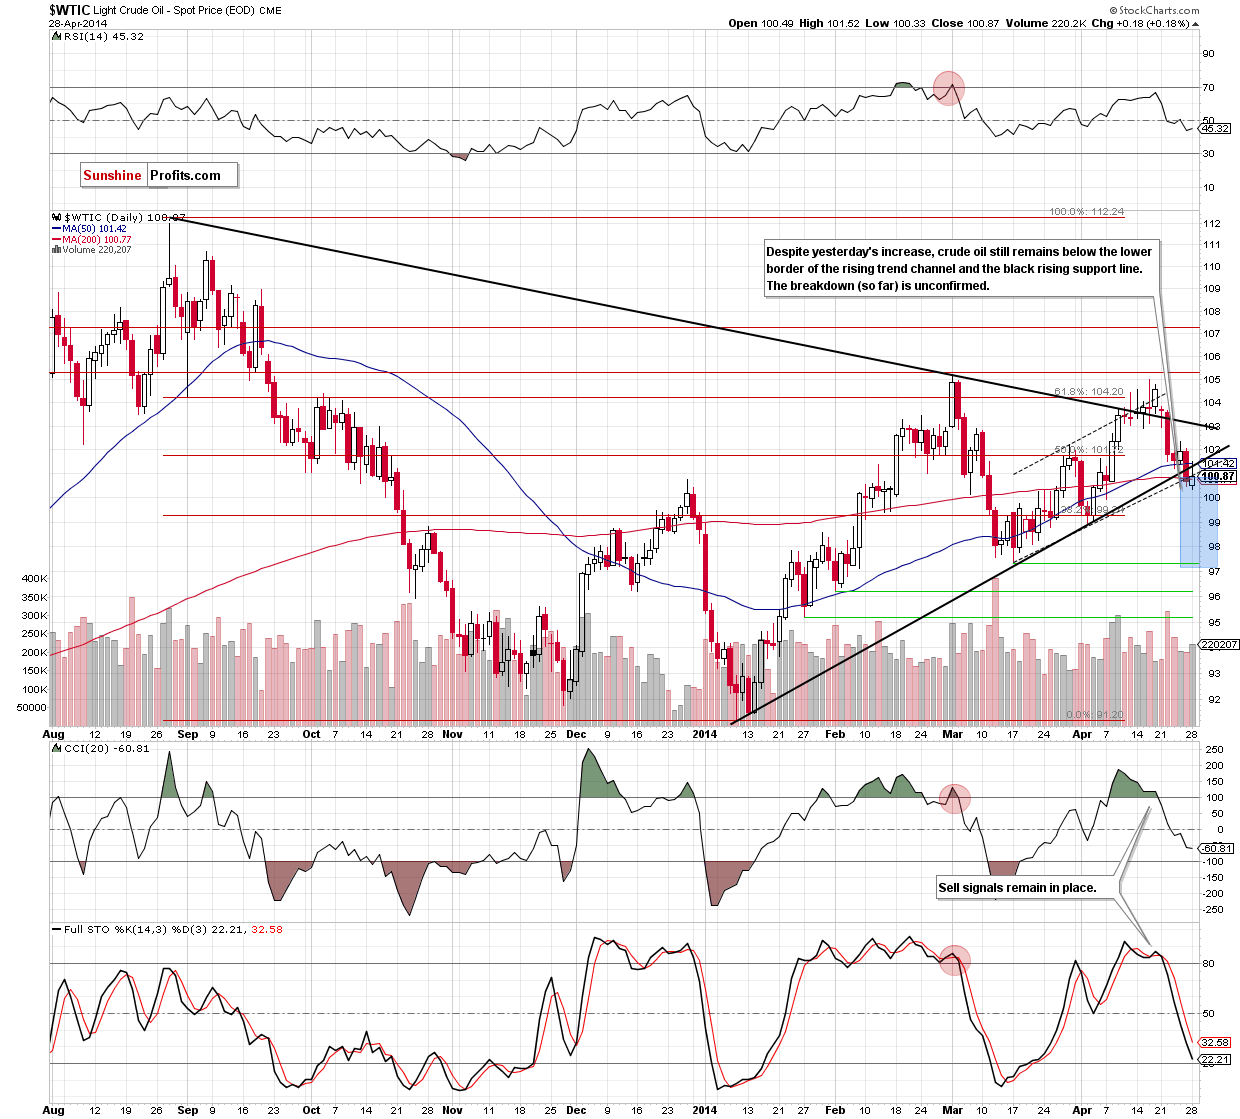
Looking at the above chart, we see that after the market open crude oil extended losses and approached more closely the psychological barrier of $100, hitting an intraday low of $100.33. As you see on the daily chart, although this strong support level encouraged buyers to act, the 50-day moving average in combination with the previously-broken rising black line (which is also the lower border of the triangle marked on the weekly chart) succesfully stopped further improvement. From today’s point of view, this price action looks like nothing more than a verification of the breakdown below the lower line of the triangle and the lower border of the rising trend channel. If this is the case, we may see further declines in the coming days and the first downside target for the sellers (which corresponds to the height of the trend channel) will be around $97 (this area is supported by the March low of $97.37). Nevertheless, we should keep in mind that as long as the psychological barrier of $100 holds, another attempt to invalidate the breakdown should not surprise us.
Summing up, although crude oil rebounded slightly yesterday, it still remains below the lower line of the triangle and the lower border of the rising trend channel, which together create a strong resistance zone. Please note that if we see another daily close below the black rising line (currently around $101.50), the breakdown will be confimed and we’ll consider opening short positions.
Very short-term outlook: bearish
Short-term outlook: bearish
MT outlook: mixed
LT outlook: mixed
Trading position (short-term): In our opinion no positions are justified from the risk/reward perspective. We will keep you informed should anything change, or should we see a confirmation/invalidation of the above.
Thank you.
Nadia Simmons
Forex & Oil Trading Strategist
Przemyslaw Radomski, CFA
Founder, Editor-in-chief
Gold & Silver Trading Alerts
Forex Trading Alerts
Oil Investment Updates
Oil Trading Alerts

