

Trading position (short-term; our opinion): No positions are justified from the risk/reward perspective.
On Wednesday, light crude lost 1.52% after the EIA report showed an unexpected increase in U.S. crude oil inventories. As a result, the commodity reversed and slipped to the previously-broken Oct high. Will we see a verification of a breakout or further declines?
Although the EIA showed that gasoline and distillate supplies declined, the report also showed that crude oil inventories rose by 2.3 million barrels in the week ended December 16. This news affected negatively investors’ sentiment and pushed the price of the commodity below $53 to the previously-broken Oct high. Will we see a verification of a breakout or further declines in the coming days?
Let’s check the charts below to find out (charts courtesy of http://stockcharts.com).
Quoting our previous alert:
(…) although indicators invalidated sell signals and light crude moved little higher in previous days, oil bulls didn’t manage to push it even to the medium-term black resistance line (not to mention an increase to higher resistance lines), which doesn’t bode well for further improvement. Additionally, the size of volume that accompanied yesterday’s move was quite small, which suggests that oil bulls may not be as strong as it seems at the first sight and reversal is just around the corner.
(…) the American Petroleum Institute reported yesterday that crude inventories in the U.S. dropped by 4.15 million barrels, gasoline inventories fell by 2.0 million barrels, while distillates declined by 1.55 million barrels in the previous week. Despite these bullish numbers, crude oil futures didn’t surge earlier today, which increases the probability of reversal in a very near future (maybe even later in the day).
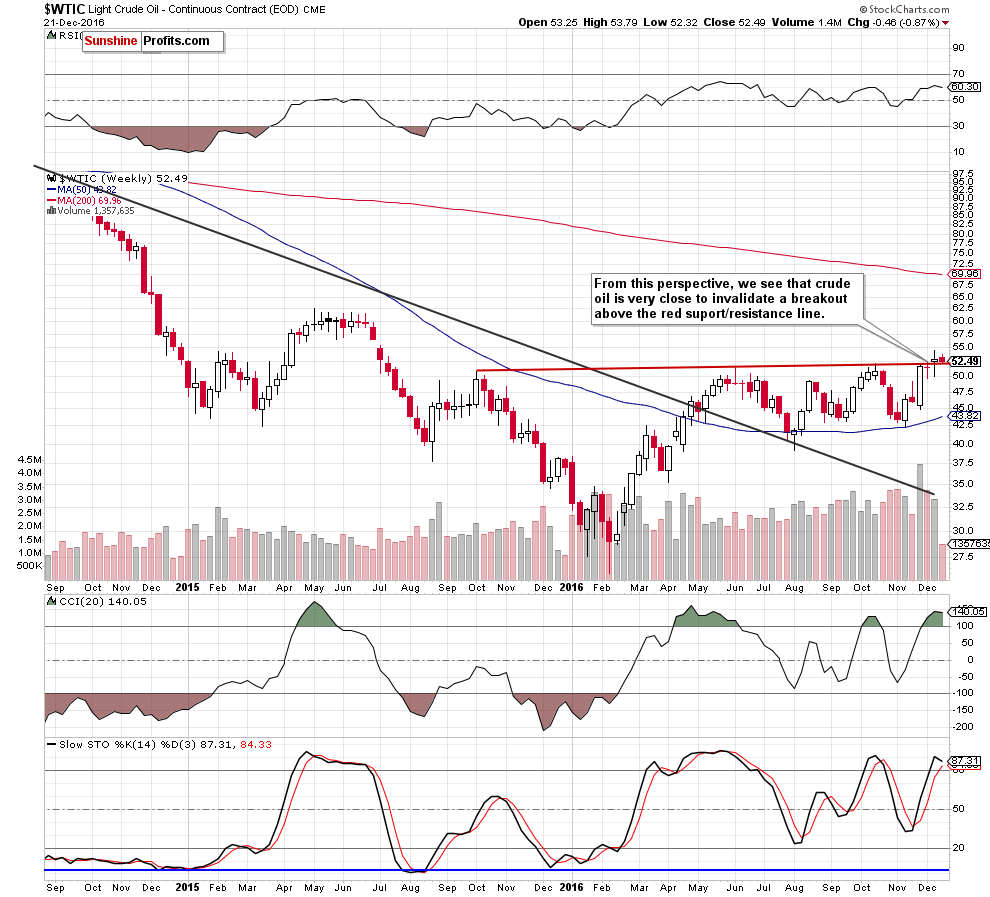
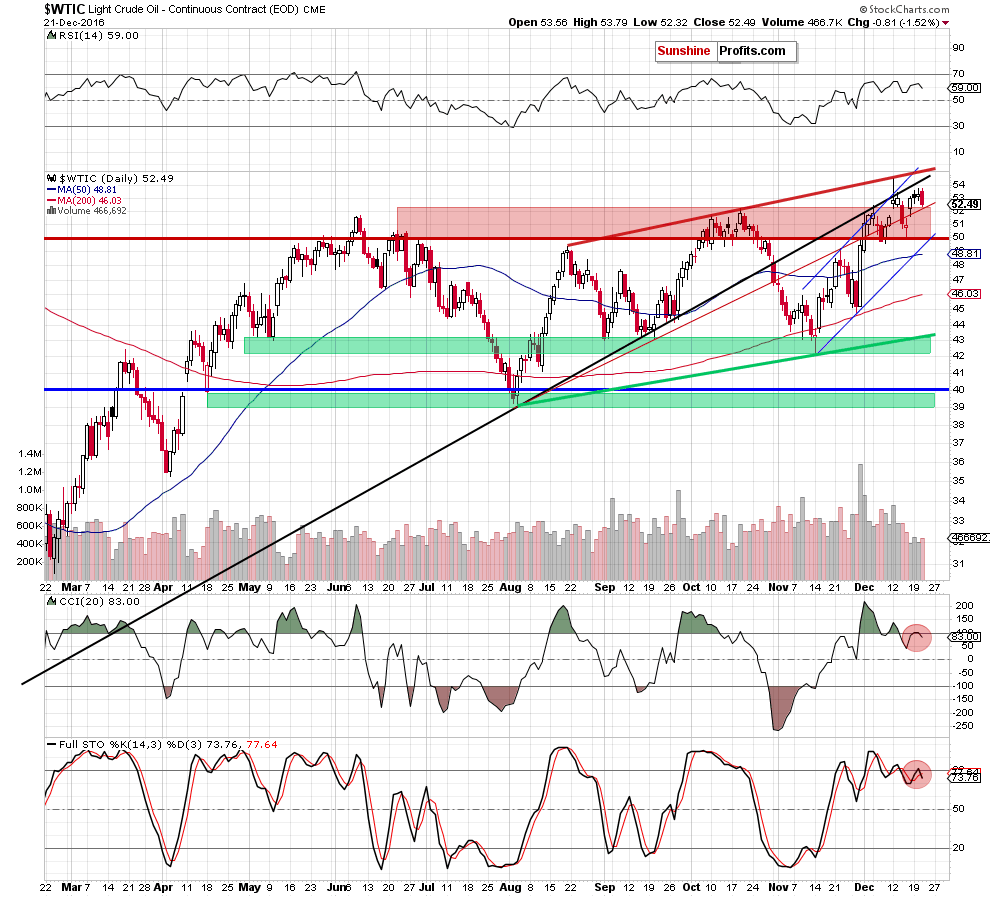
From today’s point of view, we see that the situation developed in line with the above scenario and crude oil moved lower. With yesterday’s decline the commodity slipped to the previously-broken long-term red support/resistance line (marked on the weekly chart) and the Oct high (they serve as the nearest support at the moment), which could encourage oil bulls to act later in the day. If this is the case, we’ll likely see a re-test of this week’s highs or even the medium-term black resistance line based on the Feb and Aug lows in the coming day(s).
Nevertheless, we should keep in mind that the CCI and Stochastic Oscillator re-generated sell signals and yesterday’s decline materialized on a higher volume than Tuesday’s increase, which suggests that oil bears may want to take control of the market in near future. However, in our opinion, another bigger move to the downside would be more likely if we see a daily closure below $52.22 and invalidation of the breakout above the Oct high.
Summing up, the outlook for the commodity remains more bearish than bullish as crude oil is still trading under important resistance lines and indicators generated sell signals. Nevertheless, before another attempt to move lower, light crude could move little higher (to around $53.77-$54.43) as it reached support area yesterday.
Very short-term outlook: mixed
Short-term outlook: mixed
MT outlook: mixed
LT outlook: mixed
Trading position (short-term; our opinion): No positions are justified from the risk/reward perspective. We will keep you – our subscribers – informed should anything change.
Thank you.
Nadia Simmons
Forex & Oil Trading Strategist
Przemyslaw Radomski, CFA
Founder, Editor-in-chief, Gold & Silver Fund Manager
Gold & Silver Trading Alerts
Forex Trading Alerts
Oil Investment Updates
Oil Trading Alerts

