
Trading position (short-term; our opinion): Speculative short positions in crude oil seem to be justified from the risk/reward perspective.
On Monday, crude oil gained 0.55% on concerns that the West could impose sanctions on Russia after a referendum by pro-Russian separatists in eastern Ukraine over the weekend. In this environment, light crude moved higher and invalidated the breakdown below the 200-day moving average. Did it change anything in the overall outlook?
Yesterday, crude oil moved higher after pro-Russian separatists in eastern Ukraine voted in favor of self rule in a weekend referendum. These circumstances fueled fears that the conflict may escalate further and trigger more sanctions against Russia, affecting Russian oil shipments. In our previous Oil Trading Alert, we wrote that worries over this issue have kept oil prices above the level of $100 in recent weeks. Nevertheless, although the U.S. and the European Union imposed two rounds of sanctions, they didn’t disrupt shipments from Russia. Will yesterday’s the European Union reaction to the weekend events change it? In our opinion it’s doubtful, but even if Russia decides to such steps, increased Libyan oil exports would reduce Europe's exposure to the crisis in Ukraine. Please note that yesterday Libyan officials said they reopen western oilfields and pipelines that had been blockaded by protesters. It’s also worth noting that although Russia reiterated that it could cut off Kiev's natural gas supplies as the EU expanded sanctions (targeting two Crimean companies and 13 people to aim at corporations rather than individuals), Saudi Arabia said it would step in to cover any potential shortage of oil that could result from the tension between Russia and Ukraine. What does it mean for crude oil? If we see a lot of oil released, the market may be viewed as adequately supplied, which will be bearish and affect negatively the price, pushing it back below $100.
Although the increased geopolitical risk has given a little support, the commodity is still around $100. Are there any technical signals on the horizon that could push light crude higher or lower in the near future? Let’s check (charts courtesy of http://stockcharts.com).
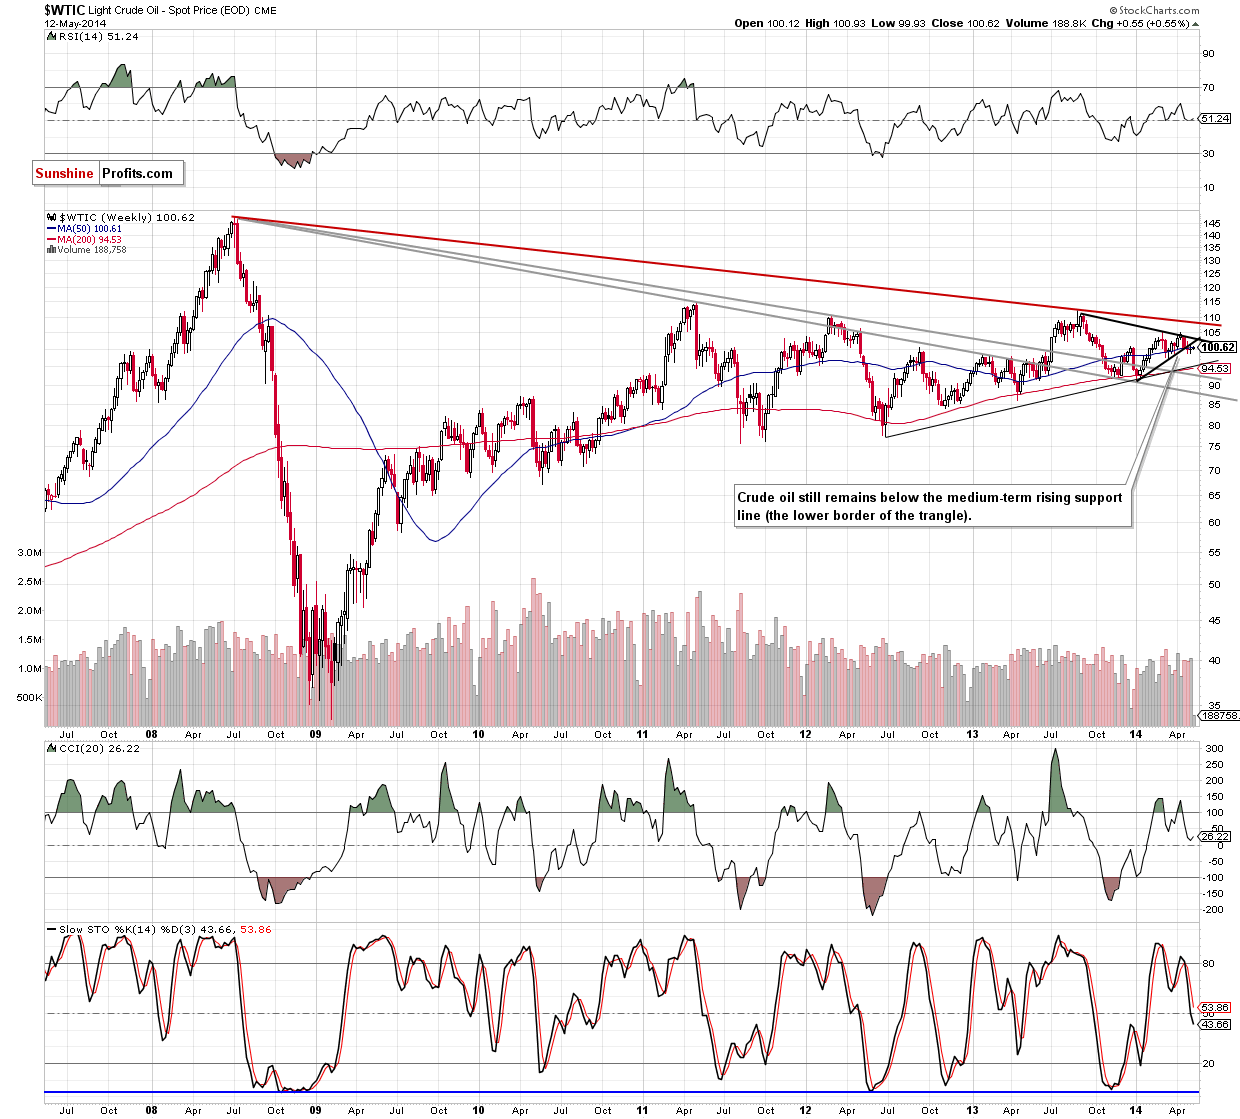
From the weekly perspective, the picture remains unchanged as crude oil is still trading below the lower border of the triangle. Therefore, the bearish scenario from our Oil Trading Alert posted on Apr. 30 is still likely:
(…) if the commodity extends losses and drops below the psychological barrier of $100, we will likely see further deterioration and a drop even to around $95, where the medium-term support line (based on the June 2012 and January 2014 lows) is. At this point, it’s worth noting that the CCI and Stochastic Oscillator generated sell signals, which suggests that another attempt to move lower should not surprise us.
Can we infer something more from the short-term chart?
In our previous alert’s summary, we wrote the following:
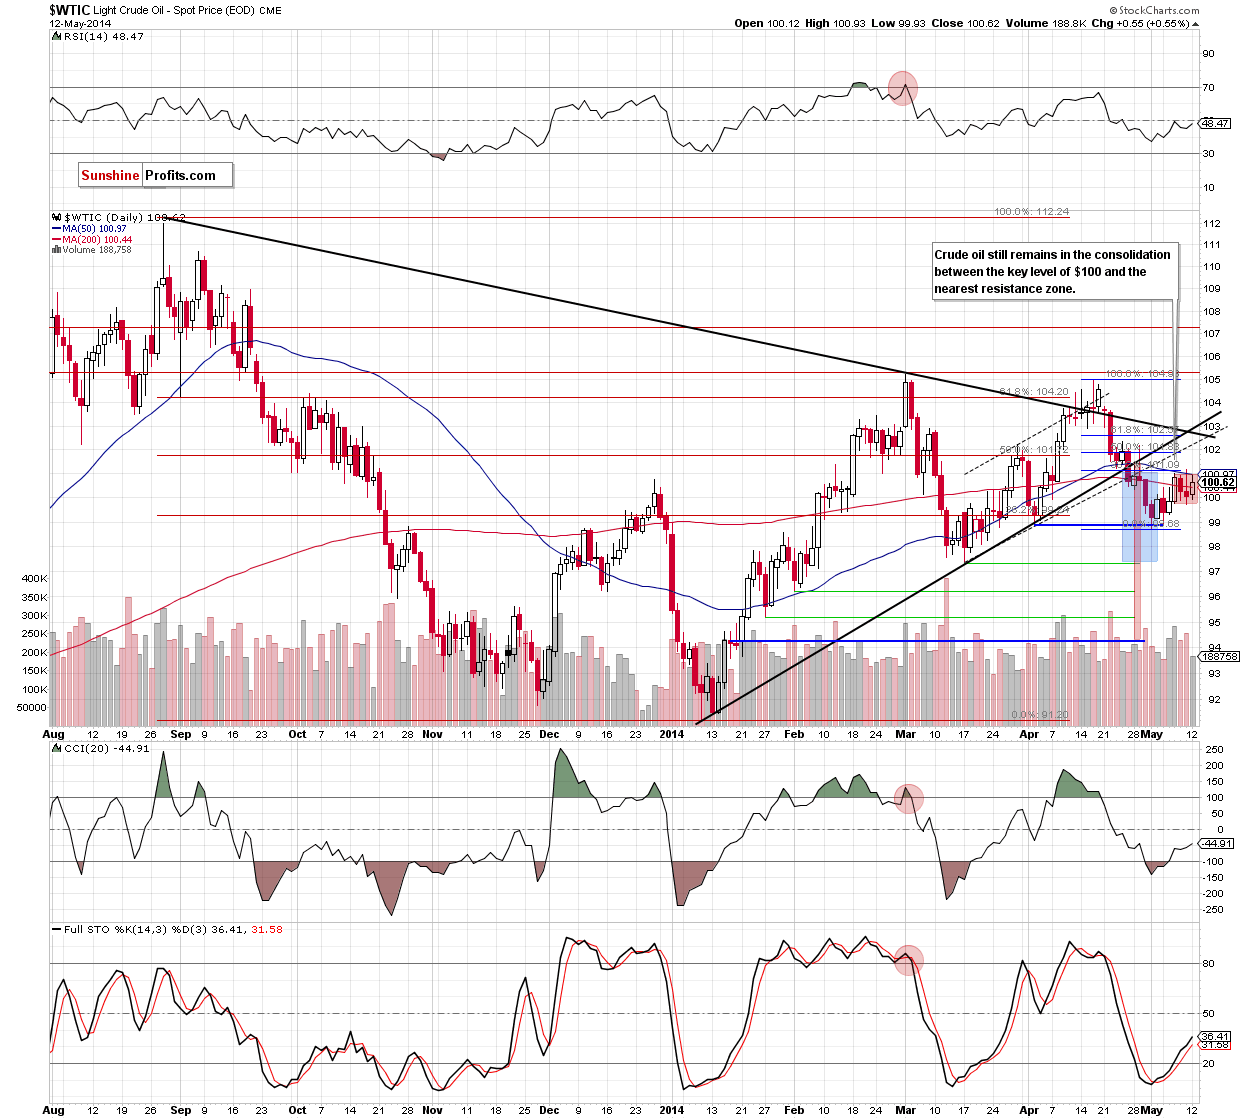
(…) crude oil remains above the psychological barrier of $100. (…) if it holds after the market’s open, we will see another attempt to break above the resistance zone (…) created by the 50-day moving average and the 38.2% Fibonacci retracement (similarly to Friday’s price action).
The above chart, clearly illustrates that light crude realized the above-mentioned scenario yesterday. With this upswing, the commodity climbed above the 200-day moving average, invalidating the breakdown (which is the good news for oil bulls). Altough this is a strong positive signal, we remain skeptical because there was similar price action on Wednesday. Back then, such circumstances were not bullish enough to trigger a breakout above the nearest resistance zone. What’s interesting, when we compare trading volumes in both cases, we notice that yesterday’s move materialized on reative smaller volume. To us, this suggests that oil bulls may not be as strong as it look at first glance and this is why we think that another downswing to around $100 is likely.
And speaking of this key level… Please keep in mind that crude oil remains in the consolidation between this major support level and the above-mentioned resistance zone. Taking this fact into account, we believe that as long as there is no breakout above the major resistance area (or breakdown below the psychological barrier of $100) another sizable move is not likely to be seen. As a reminder, even if the commodity climbs above the resistance zone and reaches the next Fibonacci retracement (around $101.80), the breakdown below the major resistance lines (the medium-term black line and the lower border of the rising trend channel) and its consequences still will be in play.
Connecting the dots, although crude oil moved higher and invalidated the breakdown below the 200-day moving average (once again), the commodity still remains in the consolidation under the resistance zone created by the 50-day moving average and the 38.2% Fibonacci retracement. As we have pointed out before, if this area is broken, the upside target will be the next Fibonacci retracement. However, if it holds, we’ll see a pullback to the lower border of the consolidation (or even to the May low) in the near future.
Summing up, our opinion remains unchanged: the final bottom in crude oil is still ahead us.
Very short-term outlook: bearish
Short-term outlook: bearish
MT outlook: mixed
LT outlook: mixed
Trading position (short-term): Short. Stop-loss order: $102.50. We will keep you informed should anything change, or should we see a confirmation/invalidation of the above.
Thank you.
Nadia Simmons
Forex & Oil Trading Strategist
Przemyslaw Radomski, CFA
Founder, Editor-in-chief
Gold & Silver Trading Alerts
Forex Trading Alerts
Oil Investment Updates
Oil Trading Alerts

