

Trading position (short-term; our opinion): Short positions (with a stop-loss order at $56.45 and an initial downside target at $45.81) are justified from the risk/reward perspective.
On Friday, crude oil lost 2.15% and declined under the barrier of $50. Does it mean that the way to lower prices is open?
Let’s examine the charts below (charts courtesy of http://stockcharts.com).
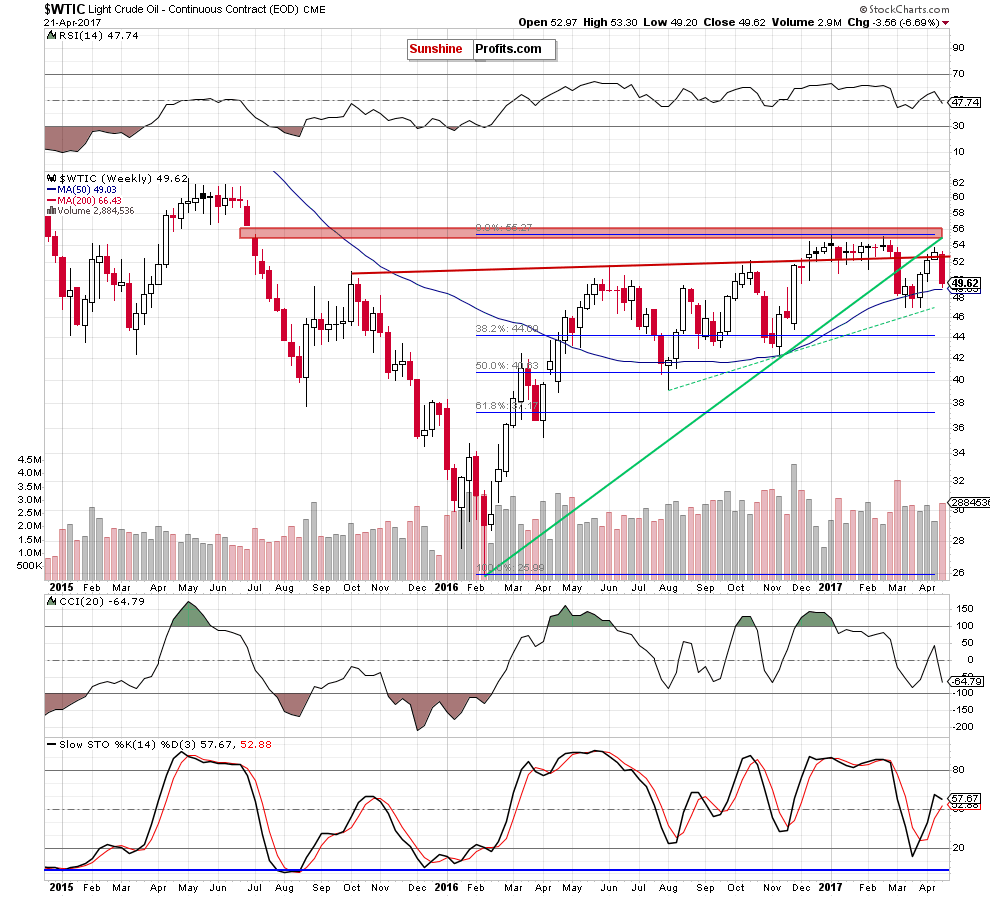
Looking at the medium-term chart, we see that an invalidation of the breakout above the long-term red resistance line triggered a sharp decline, which took light crude below the barrier of $50. Last week’s move materialized on bigger volume than earlier increases, which confirms oil bears’ strength and suggests further deterioration in the coming week – especially if the commodity drops below the 50-week moving average and the recent lows.
How did this decline affect the very short-term picture? Let’s examine the daily chart and find out.
Quoting our Thursday’s alert:
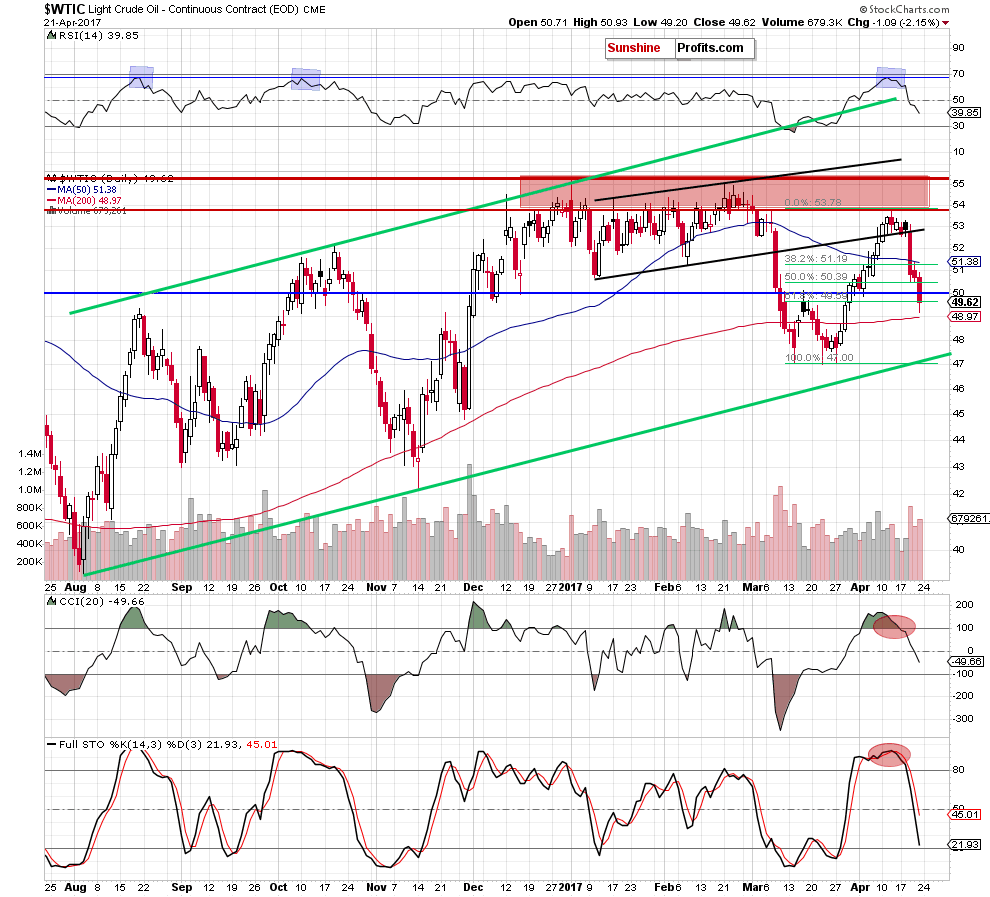
(…) crude oil reversed and declined under the previously-broken lower border of the black rising trend channel, invalidating the earlier tiny breakout. This bearish development triggered a sharp decline, which corrected almost 50% of the March-April upward move. (…) yesterday’s move materialized on significant volume, which confirms oil bears’ strength, suggesting further deterioration – especially when we factor in the medium-term picture and the sell signals generated by the daily indicators.
Taking all the above into account, we believe that the commodity will test the barrier of $50 in the coming day(s). If this important support is broken, the next target will be around $49.58, where the 61.8% Fibonacci retracement is.
From today’s point of view, we see that the situation developed in tune with our assumptions and crude oil not only declined under the barrier of $50, but also slipped under the 61.8% Fibonacci retracement, approaching the 200-day moving average.
Although this support triggered a small rebound on Friday, the sell signals generated by the indicators remain in place, supporting oil bears and lower prices of crude oil.
How low could the black gold go in the coming days? In our opinion, if light crude extends losses and drops below the 200-day moving average, the next downside target will be around $47-$47.15, where the recent lows and the lower border of the long-term green rising trend channel currently are.
Summing up, short (profitable) positions continue to be justified as crude oil closed the previous week not only under the long-term red line and lower border of the black rising trend channel, but also below the psychologically important barrier of $50, which could encourage oil bears to act and trigger another downswing in the coming week.
Very short-term outlook: bearish
Short-term outlook: mixed with bearish bias
MT outlook: mixed
LT outlook: mixed
Trading position (short-term; our opinion): Short positions (with a stop-loss order at $56.45 and an initial downside target at $45.81) are justified from the risk/reward perspective. We will keep you informed should anything change, or should we see a confirmation/invalidation of the above.
As a reminder – “initial target price” means exactly that – an “initial” one, it’s not a price level at which we suggest closing positions. If this becomes the case (like it did in the previous trade) we will refer to these levels as levels of exit orders (exactly as we’ve done previously). Stop-loss levels, however, are naturally not “initial”, but something that, in our opinion, might be entered as an order.
Thank you.
Nadia Simmons
Forex & Oil Trading Strategist
Przemyslaw Radomski, CFA
Founder, Editor-in-chief, Gold & Silver Fund Manager
Gold & Silver Trading Alerts
Forex Trading Alerts
Oil Investment Updates
Oil Trading Alerts

