
On Friday, crude oil was trading in a narrow range as oil investors tried to puzzle out the impact of a larger-than-expected increase in U.S. job creation in October. Light crude hit its daily low of $93.90 and then rebounded to its daily high of $94.92, but it closed Friday at Thursday’s closing price.
On Friday, the Labor Department said that U.S. payrolls advanced by 204,000 jobs last month, well above economists' forecast for a gain of 120,000. Readings for the prior two months were revised up by a total of 60,000, putting average job creation over the three-month span above a 200,000 pace, matching the strong gains recorded early in the year. Additionally, private-sector employers added 212,000 jobs in October, the strongest gain since February, suggesting companies didn't curtail hiring in the face of Washington turmoil.
The nation's unemployment rate, obtained through a separate survey of households, rose slightly to 7.3% from 7.2% in September. The small increase reflects employees who were furloughed during a 16-day shutdown but have since returned to work.
The improvement, if backed by other data in the coming weeks, could give Fed officials enough comfort about the economy's progress to reduce the pace of their $85 billion-a-month bond-buying program at their December meeting. On one hand, a cutback in stimulus by the Fed later this year would remove a reliable prop for oil prices. On the other hand, the figures suggest economic improvement, raising the prospect for stronger oil demand in the world's biggest energy consumer, and laying the groundwork for higher prices.
Having discussed the above, let’s move on to the technical changes in the crude oil market (charts courtesy of http://stockcharts.com).
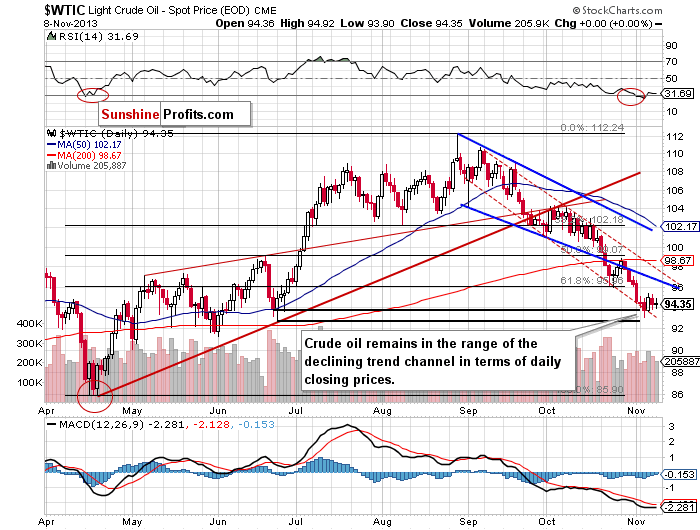
Looking at the above chart we clearly see that the situation didn’t change on Friday, and what we wrote in our previous Oil Trading Alert is still up-to-date:
(…) crude oil still remains in the range of the declining trend channel in terms of daily closing prices (marked with the red dashed line). (…) the lower border of this channel (currently around $93) and the bottom of the corrective move that we saw in June (in terms of daily closing prices) still serve as support.
Please note that the recent days have formed a consolidation on the above chart. Therefore, if the oil bulls push crude oil above Wednesday’s top we will likely see an upward move to the lower border of the declining trend channel (in terms of intraday lows – marked with bold blue line) – currently around $96.50. However, if they fail, oil bears will likely make oil test the strength of the November low, which currently intersects with the lower border the declining trend channel (in terms of daily closing process – marked with thin red line).
Once we know the current situation in crude oil, let’s move on to the XOI daily chart.
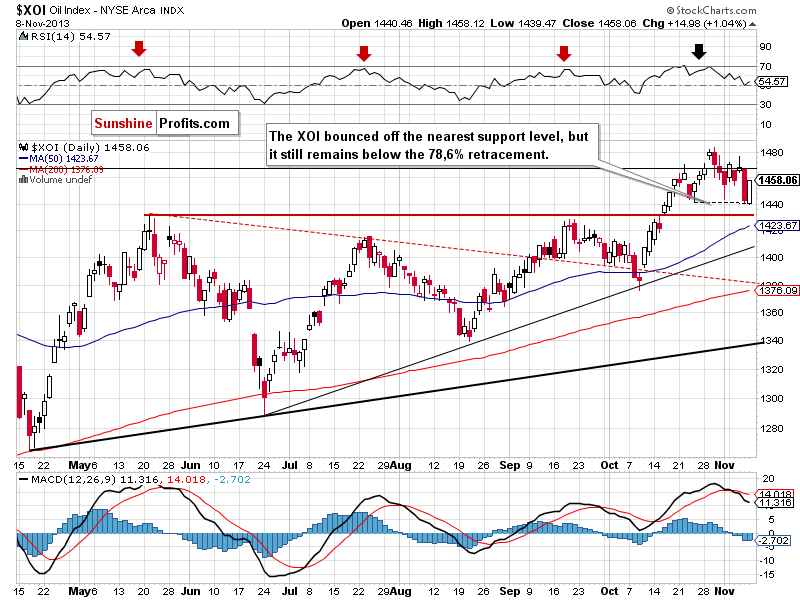
On Thursday, the oil stocks index bounced off the 78.6% Fibonacci retracement level, which resulted in a drop to its daily low at 1,440. In this way, the XOI reached the bottom of the recent corrective move. Nevertheless, similarly to what we saw in the previous week, this support level encouraged buyers to act and we saw a pullback.
Although the oil stocks index rebounded sharply on Friday, it didn’t move above the 78.6% retracement, which still serves as strong resistance. Therefore, it seems that as long as the XOI remains below this level, further increases are limited.
Quoting our previous Oil Trading Alert:
(…) There’s also another bearish factor for the XOI Index – its tight link to the general stock market, and the outlook for the latter. Stocks have recently been moving in tune with their True Seasonal patterns and if this tendency continues (and the XOI-stocks link remains in place), then we can expect both the general stock market and oil stocks to decline in the coming weeks.
Summing up, the situation hasn’t changed much and crude oil remains in the declining trend channel in terms of daily closing prices. The lower border of this channel and the bottom of the corrective move that we saw in June (in terms of daily closing prices) still serve as support. As we wrote in our previous Oil Trading Alert, it’s too early to assume that the final bottom of the recent corrective move is already in.
Very short-term outlook: bearish
Short-term outlook: bearish
MT outlook: bearish
LT outlook: unclear
Trading position (short-term): Taking into account the medium- and short-term picture, we do not suggest opening any positions yet.
Thank you.
Nadia Simmons
Sunshine Profits' Crude Oil Expert
Oil Investment Updates
Oil Trading Alerts

