
On Monday, crude oil lost 0.42% as consumer sentiment gauge missed expectations. Light crude fell for the first time in six sessions and closed the day below $99 per barrel.
Yesterday, a widely-watched consumer sentiment gauge missed expectations, which encouraged traders to cash in on recent gains and pushed the price lower. The Thomson Reuters/University of Michigan's overall consumer sentiment index held at 82.5 in December (unchanged from an initial estimate), while analysts were hoping for the index to climb to 83.0. Please note that the Michigan consumer sentiment index stood at 75.1 in November, therefore, yesterday’s losses were somewhat limited as markets viewed an unchanged December figure as better than a surprise decline.
The report came after the Bureau of Economic Analysis said that U.S. personal spending rose 0.5% last month, matching expectations. Personal spending for October was revised up to a 0.4% gain from a previously reported increase of 0.3%. The report also showed personal income rose 0.2% in November, missing expectations for a 0.5% increase, after falling by 0.1% in October.
Despite Monday's pause, it seems that as long as economic data continues to point to improvement in the world's largest oil consumer, the price of light crude will be supported. It’s worth noting that yesterday’s volume was light as some market participants have pulled out of the market ahead of the Christmas holiday on Wednesday.
Please note that today, the American Petroleum Institute releases its weekly oil inventory data for the week ended Dec. 20, but widely watched supply and demand figures from the federal Energy Information Administration have been delayed until Friday by the holiday.
Having discussed the above, let’s move on to the technical changes in the crude oil market (charts courtesy of http://stockcharts.com).
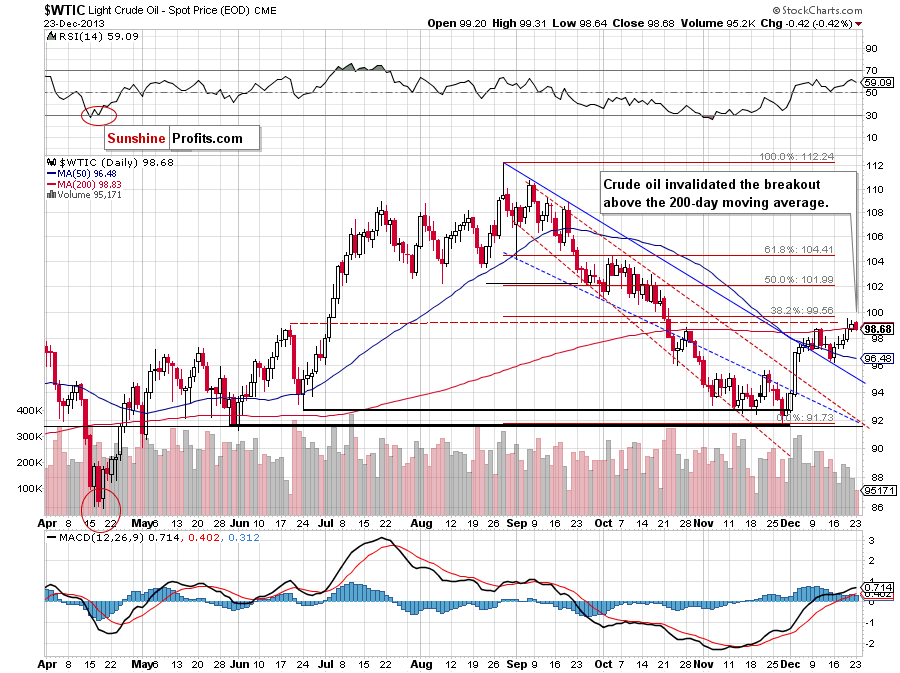
Looking at the above chart, we see that the situation has deteriorated slightly as crude oil slipped below the 200-day moving average. An invalidation of the breakout above this level is a bearish signal, but when we take a closer look, we see that this downswing materialized on small volume, which is not as bearish as it seems at first sight. Nevertheless, the proximity to the 38.2% Fibonacci retracement level (at $99.56) and the psychological barrier of $100 may trigger a pause or pullback, which should not surprise us – especially after five days of gains. Additionally, recent candlesticks formed a bearish engulfing pattern, which may encourage the sellers to act. Please note that the nearest support is around $97.26, where the last Tuesday‘s low is. The next is the 50-day moving average (currently at $96.63).
Having discussed the current situation in crude oil, let’s take a look at WTI Crude Oil (the CFD).
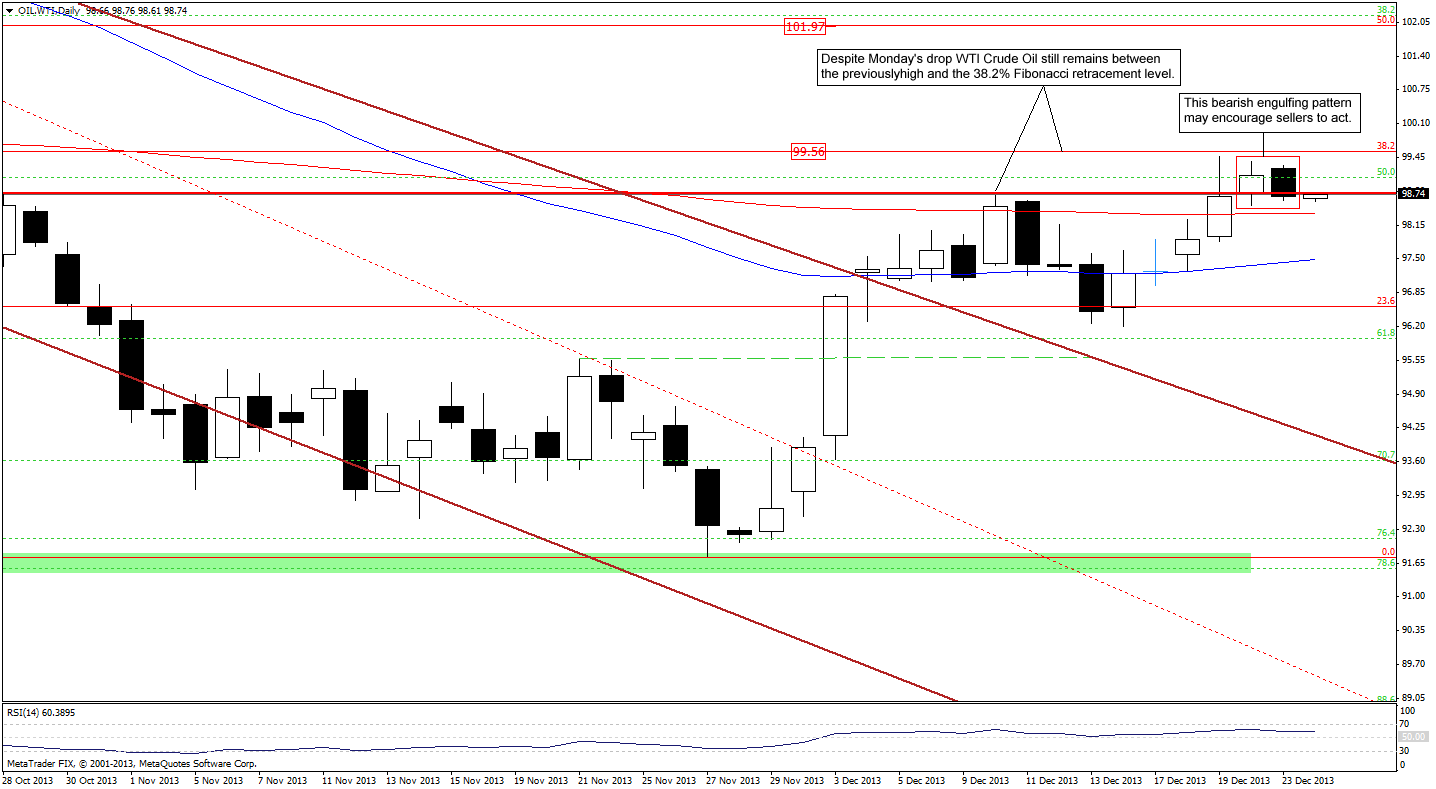
On the above chart, we see that yesterday’s drop resulted in a black candle stick, which together with the Friday’s white candle formed a bearish engulfing pattern. This reversal pattern may encourage sellers to act and push the price lower. In this case, the nearest support is the 200-day moving average. If it is broken, the next will be at $97.84, where the Dec. 19 low is. Nevertheless, despite yesterday’s little drop, WTI Crude Oil still remains in a narrow range between the previous high and the 38.2% Fibonacci retracement level. If this bearish pattern is invalidated and the CFD climbs above the 38.2% retracement, the next upside target will be the 50% Fibonacci retracement.
Once we know the above, let’s take a look at the NYSE Arca Oil Index (XOI) chart.
Quoting our previous Oil Trading Alert:
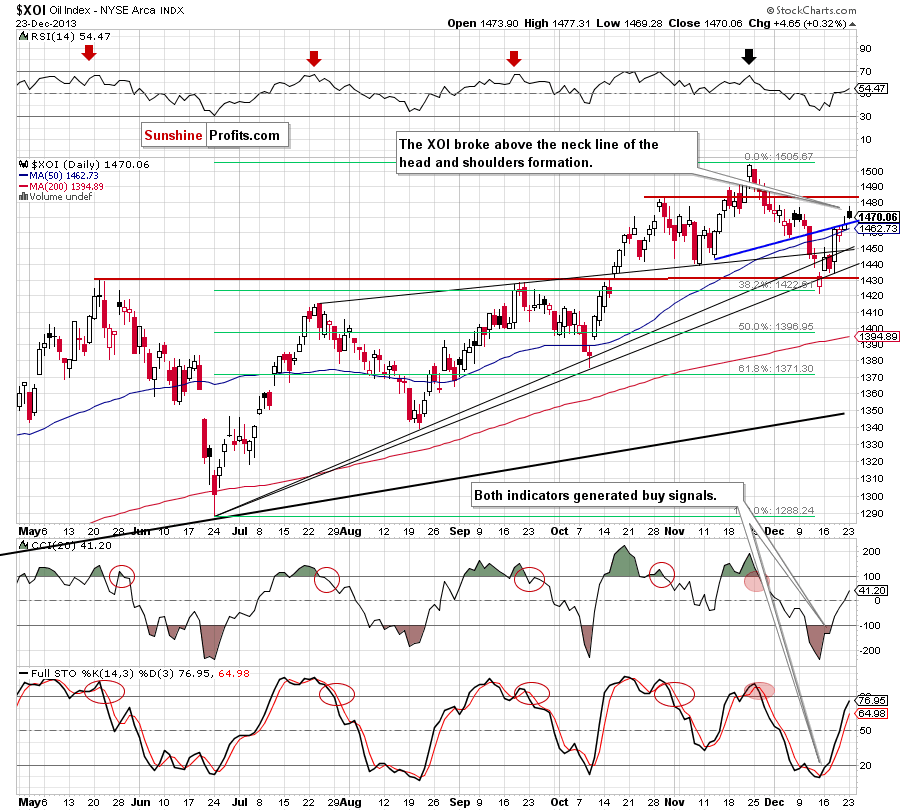
(...) if the XOI breaks above this major medium-term resistance, we will likely see an upswing to at least 1,476 or even to 1,483 where the previously 2013 high is (…) please note that the CCI and Stochastic Oscillator generated buy signals, which supports further improvement in the near future.
Looking at the above chart, we see that the oil stock index extended its gains and broke above the neck line of the head and shoulders formation. With this upswing, the XOI also came back above the upper line of the medium-term rising wedge, which is a bullish sign. As you can see on the above chart, the oil stock index reached its first upside target and climbed to slightly above the Dec. 9 high. If the buyers do not give up, we may see further improvement and the next target will be around 1,483. Please note that the nearest support is the upper line of the medium-term rising wedge (currently around 1,466).
Summing up, crude oil invalidated the breakout above the 200-day moving average, which is not a positive sign for oil bulls and will likely trigger a pause or a pullback in the coming days but the situation remains bullish.
Very short-term outlook: bullish
Short-term outlook: bullish
MT outlook: mixed with bullish bias
LT outlook: mixed
Trading position (short-term): Long. Stop-loss order for this position: $91.55. Stop-loss order for WTI Crude Oil (CFD): $91.30. We will keep you informed should anything change, or should we see a confirmation/invalidation of the above.
Thank you.
Nadia Simmons
Sunshine Profits' Crude Oil Expert
Oil Investment Updates
Oil Trading Alerts

