

Trading position (short-term; our opinion): Short positions with a stop-loss order at $65.23 are justified from the risk/reward perspective.
Although crude oil moved little higher after the markets open, the commodity reversed and declined sharply as traders closed their speculative positions after positive EIA weekly report. As a result, light crude lost 2.34% and invalidated earlier breakout above the resistance line. What does it mean for the commodity?
Yesterday, crude oil moved higher after the market’s open supported by a weaker greenback. However, the situation changed after the EIA weekly report. As a reminder, the U.S. Energy Information Administration reported that domestic crude oil inventories fell by 1.9 million barrels in the week ended May 29, in line with forecasts of a 2.0 million draw (additionally, supplies at Cushing, Oklahoma declined by 983,000 barrels last week, beating expectations for a drop of 500,000 barrels). Despite this decline, total U.S. crude oil inventories remain near levels not seen for this time of year in at least the last 80 years, while U.S. crude output stays over 9.5 million bpd for the second straight week. In these circumstances, traders closed their speculative positions, triggering a sharp decline, which invalidated the breakout above the resistance line. What does it mean for the commodity? (charts courtesy of http://stockcharts.com).
Quoting our previous Oil Trading Alert:
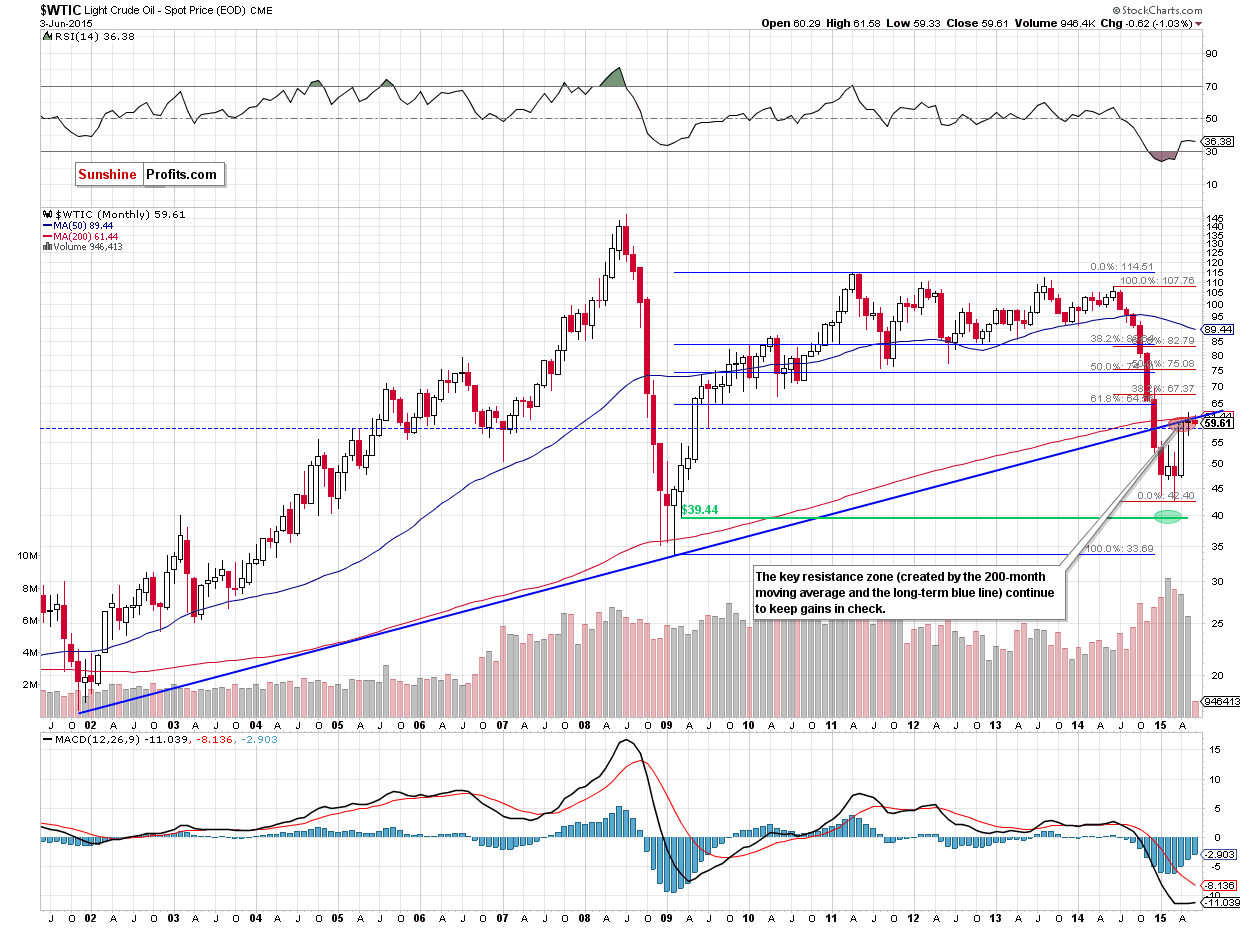
(…) although crude oil moved higher in the recent days, the key resistance zone (created by the long-term blue resistance line and the 200-month moving average) continues to keep gains in check. In our opinion, this means that as long as there is no successful breakout above this area further rally is not likely to be seen and further deterioration is more likely than not.
Looking at the monthly chart, we see that the above-mentioned resistance area encouraged oil bears to act, which resulted in a pullback and a drop below $60.
What impact did this decline have on the very short-term picture? Let’s check.
Yesterday, we wrote the following:
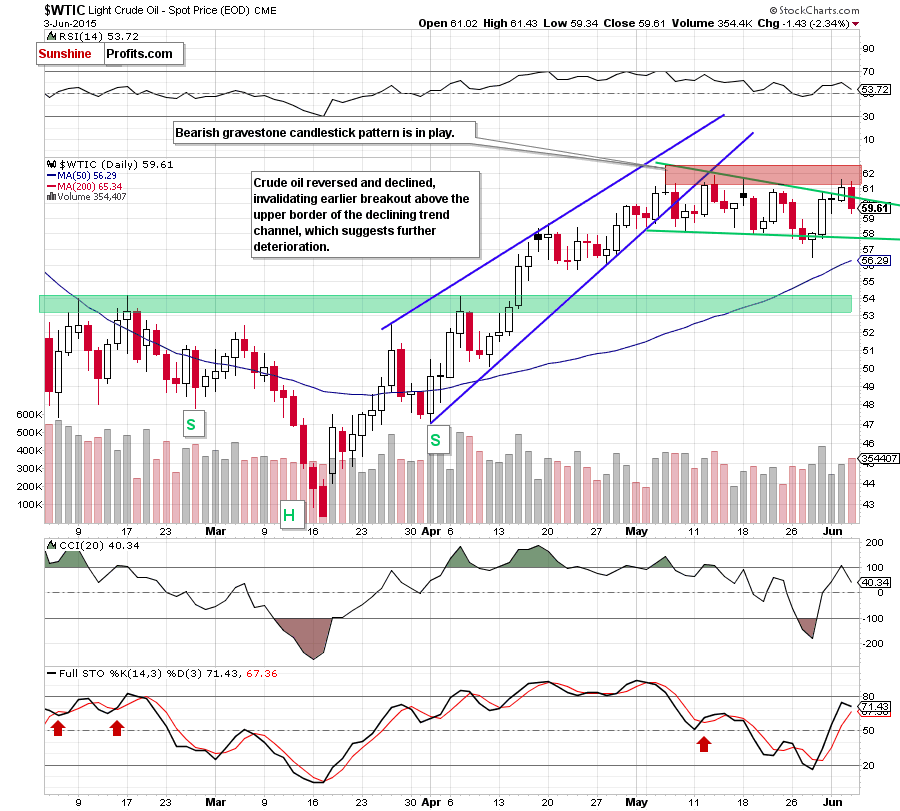
(…) crude oil extended gains and broke above the upper border of the green declining trend channel. Although this is a positive signal, (…) the size of volume that accompanied yesterday’s increase wasn’t huge, which means that oil bulls might not be as strong as it seems at the first sight. Additionally, the commodity reached the red resistance zone created by the May highs (and reinforced by a bearish gravestone candlestick pattern), which could stop further improvement – especially when we factor in the long-term picture.
From today’s point of view, we see that the situation developed in line with the above scenario and crude oil moved lower. With this downswing, light crude declined below the upper border of the green declining trend channel, invalidating earlier breakout, which is a bearish signal. Additionally, yesterday’s downswing materialized on higher volume than previous increases, which suggests that oil bears are getting stronger. On top of that, when we take a closer look at the daily chart, we notice that the CCI generated a sell signal, while the Stochastic Oscillator is overbought, which could translate o a sell signal in the coming day(s).
Taking all the above into account, and combining with the long-term picture, we believe that the next move will be to the downside. If this is the case, and crude oil moves lower from here, the initial downside target would be around $58, where the lower border of the green declining trend channel is. Please note that if this support is broken, we’ll see a test of the recent low of $56.51 (which is only slightly above the 50-day moving average at the moment) or even a drop to the green support zone created by the Feb highs.
Summing up, crude oil declined sharply, invalidating earlier breakout above the upper border of the declining trend channel, which is a bearish signal that suggests further deterioration (especially when we factor in the size of volume and the current position of the daily indicators) and a drop to around $58 in the coming day(s).
Very short-term outlook: bearish
Short-term outlook: bearish
MT outlook: mixed with bearish bias
LT outlook: mixed with bearish bias
Trading position (short-term; our opinion): Short positions with a stop-loss order at $65.23 are justified from the risk/reward perspective. We will keep you – our subscribers – informed should anything change.
Thank you.
Nadia Simmons
Forex & Oil Trading Strategist
Przemyslaw Radomski, CFA
Founder, Editor-in-chief
Gold & Silver Trading Alerts
Forex Trading Alerts
Oil Investment Updates
Oil Trading Alerts

