

Trading position (short-term; our opinion): Short positions (with a stop-loss order at $56.45 and an initial downside target at $45.81) are justified from the risk/reward perspective.
On Monday, the black gold lost 0.71% as oil investors reacted to the Friday’s Baker Hughes’ report, which showed a further rise in the number of rigs in the U.S. In this environment, light crude slipped under the previously-broken 50% Fibonacci retracement, invalidating the earlier breakout. Will it encourage oil bears to push the commodity below the barrier of $50 in the coming days?
Let’s examine the charts below to find out (charts courtesy of http://stockcharts.com).
On Friday, we wrote the following:
(…) this week’s upward move is similar to the February’s rebound (both marked with blue rectangles), which means that oil bulls are not stronger than they were in the previous month at the moment of writing these words. This suggests that reversal and lower prices may be just around the corner – especially when we factor in the (…) red resistance zone.
Yesterday, we added:
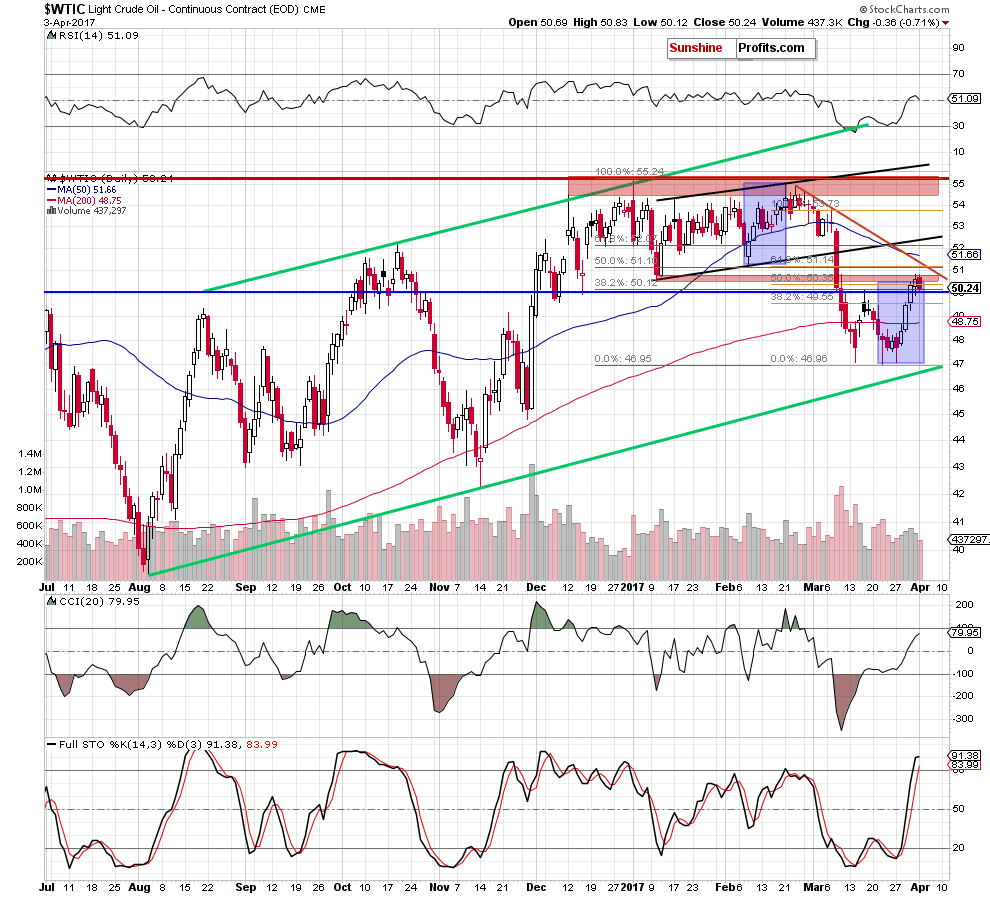
(…) not far from current levels (around $51.10-$51.14) is also a very strong resistance created by the 50% Fibonacci retracement based on the entire January – March downward move and the 61.8% retracement based on the March declines, which could encourage oil bears to act in the coming day(s). At this point, it is worth noting that similar combination of retracements stopped declines a week ago, which suggests that we may see similar reaction (but in opposite direction) in the very near future.
Looking at the daily chart, we see that the combination of the above-mentioned factors encouraged oil bears to act, which resulted in a pullback. With yesterday’s downswing light crude slipped under the previously-broken 50% Fibonacci retracement (based on the March declines), invalidating the earlier breakout, which is a negative sign. Additionally, the Stochastic Oscillator climbed to its overbought area, which suggests that we may see a sell signal in the coming day(s).
On top of that, when we zoom out our picture and take a closer look at the long-term chart, we notice additional negative signals.
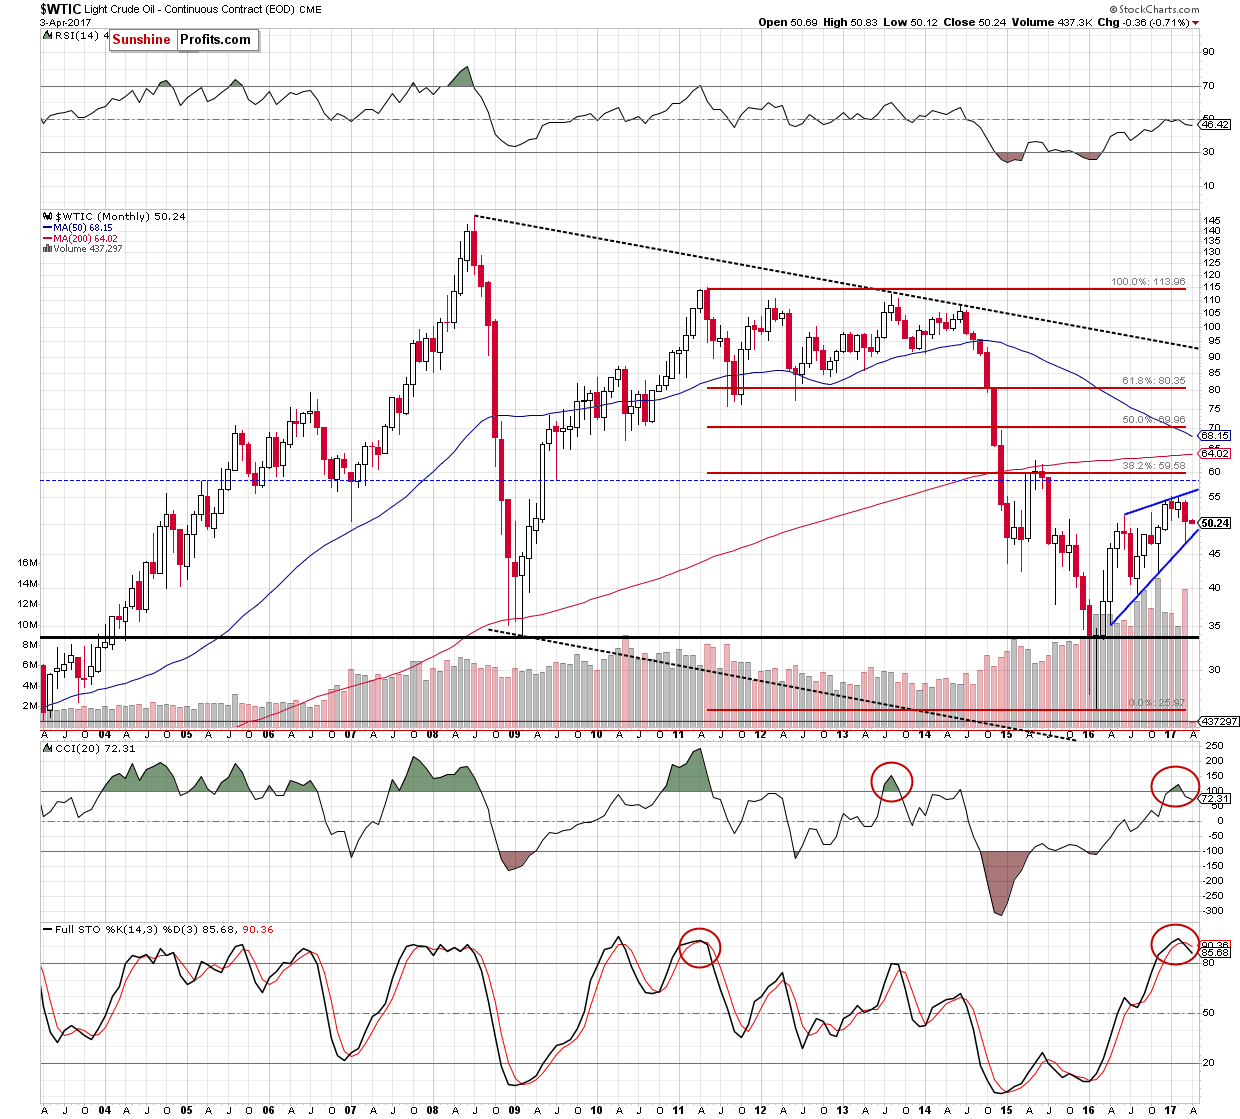
From this perspective, we see that the lower border of the blue rising wedge triggered a rebound in the previous month. Despite this move, sell signals generated by the CCI and the Stochastic Oscillator remain in place, supporting oil bears and another attempt to move lower. At this point, it is worth keeping in mind that we saw a similar situation long time ago – in October 2013 (in the case of the CCI) and June 2011 (in the case of the Stochastic Oscillator). In both cases, the sell signals preceded bigger declines, which increases the probability that we’ll see similar price action in the coming weeks.
The pro bearish scenario is also reinforced by the current situation the non-USD ratio.

Quoting our Friday’s alert:
(…) this week’s increases took the ratio to the 38.2% Fibonacci retracement based on the entire 2017 downward move, which could trigger a pullback in the coming week. Additionally, similarly to what we saw in the case of crude oil priced in U.S. dollars, both upswings (the current and the one seen at the beginning of the year) are very similar, which increases the probability of reversal in a very near future.
On top of that, as long as there is no increase above the red horizontal resistance line (the bottom of the potential wave 1), the current move could be considered as the wave 4 in a 5-wave decline (according to the Elliot Wave Theory). If this is the case, and the ratio reverses and moves lower from here, we’ll see a fresh 2017 low not only in the ratio, but also in crude oil (or even another re-test of the recent lows and the green support line, which will be higher in the coming week).
From today’s point of view, we see that the ratio reversed and slipped under the 38.2% Fibonacci retracement, invalidating the earlier breakout, which doesn’t bode well for improvement and suggests that further deterioration is just around the corner.
Did this drop have any impact on the weekly chart? Let’s check.
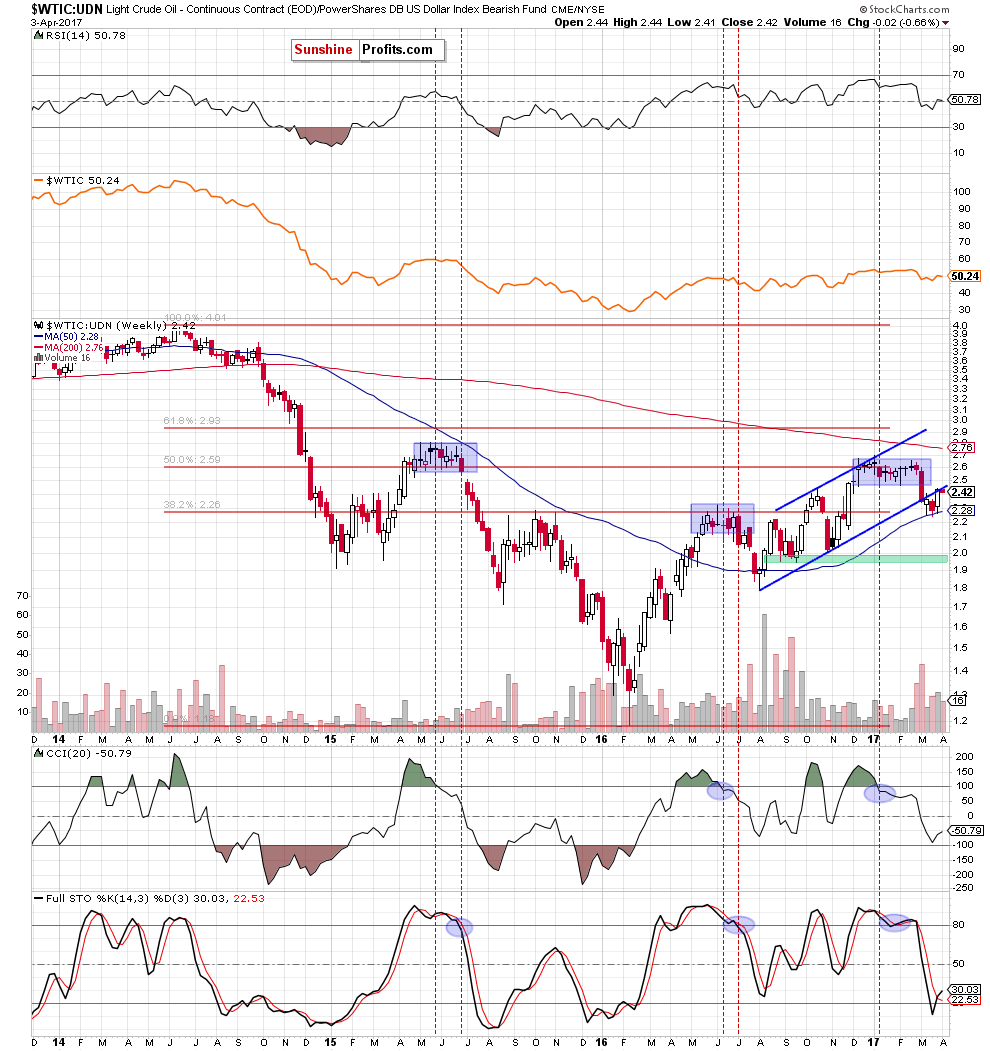
The first thing that catches the eye on the weekly chart is the drop below the lower border of the blue rising trend channel, and an invalidation of the earlier tiny breakout above this line, which increases the probability of declines – not only in the case of the ratio, but also in the case of crude oil priced in U.S. dollars.
Summing up, short positions continue to be justified as the picture, which emerges from the above charts suggests that another attempt to move lower is just around the corner.
Very short-term outlook: bearish
Short-term outlook: mixed with bearish bias
MT outlook: mixed
LT outlook: mixed
Trading position (short-term; our opinion): Short positions (with a stop-loss order at $56.45 and an initial downside target at $45.81) are justified from the risk/reward perspective. We will keep you informed should anything change, or should we see a confirmation/invalidation of the above.
Thank you.
Nadia Simmons
Forex & Oil Trading Strategist
Przemyslaw Radomski, CFA
Founder, Editor-in-chief, Gold & Silver Fund Manager
Gold & Silver Trading Alerts
Forex Trading Alerts
Oil Investment Updates
Oil Trading Alerts

