
Trading position (short-term; our opinion): No positions are justified from the risk/reward perspective.
On Thursday, crude oil lost 1.1% as news that Saudi Arabia lowered the price of oil for buyers in the U.S. and Asia. In this environment, light crude dropped for the third time in a row, but did this move deteriorate the overall picture of the commodity?
Yesterday, Saudi Arabia lowered official selling prices for its crude in January to the lowest in at least 14 years for buyers in the U.S. and Asia. This suggests that the kingdom is not intend to give up the battle for market share with cheaper U.S. shale oil after last week's OPEC decision to keep production quotas unchanged. This news pushed the price of the commodity lower and light crude closed the day below $67 for the first time this month. Did this move change anything? (charts courtesy of http://stockcharts.com).
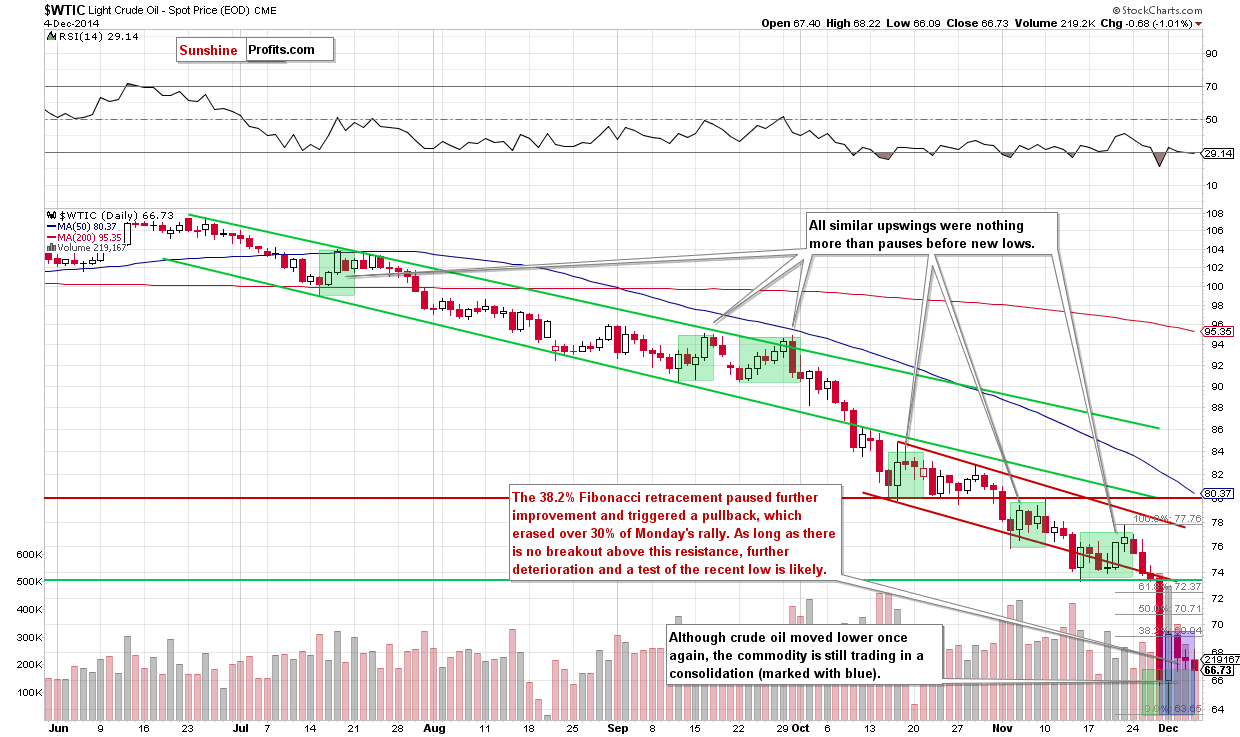
As you see on the daily chart, although crude oil moved little higher after the market’s open, the commodity reversed and declined for the third time in a row. Although this is a negative sign, yesterday’s move didn’t change the overall picture of the commodity, which means that what we wrote in our previous Oil Trading Alert is up-to-date:
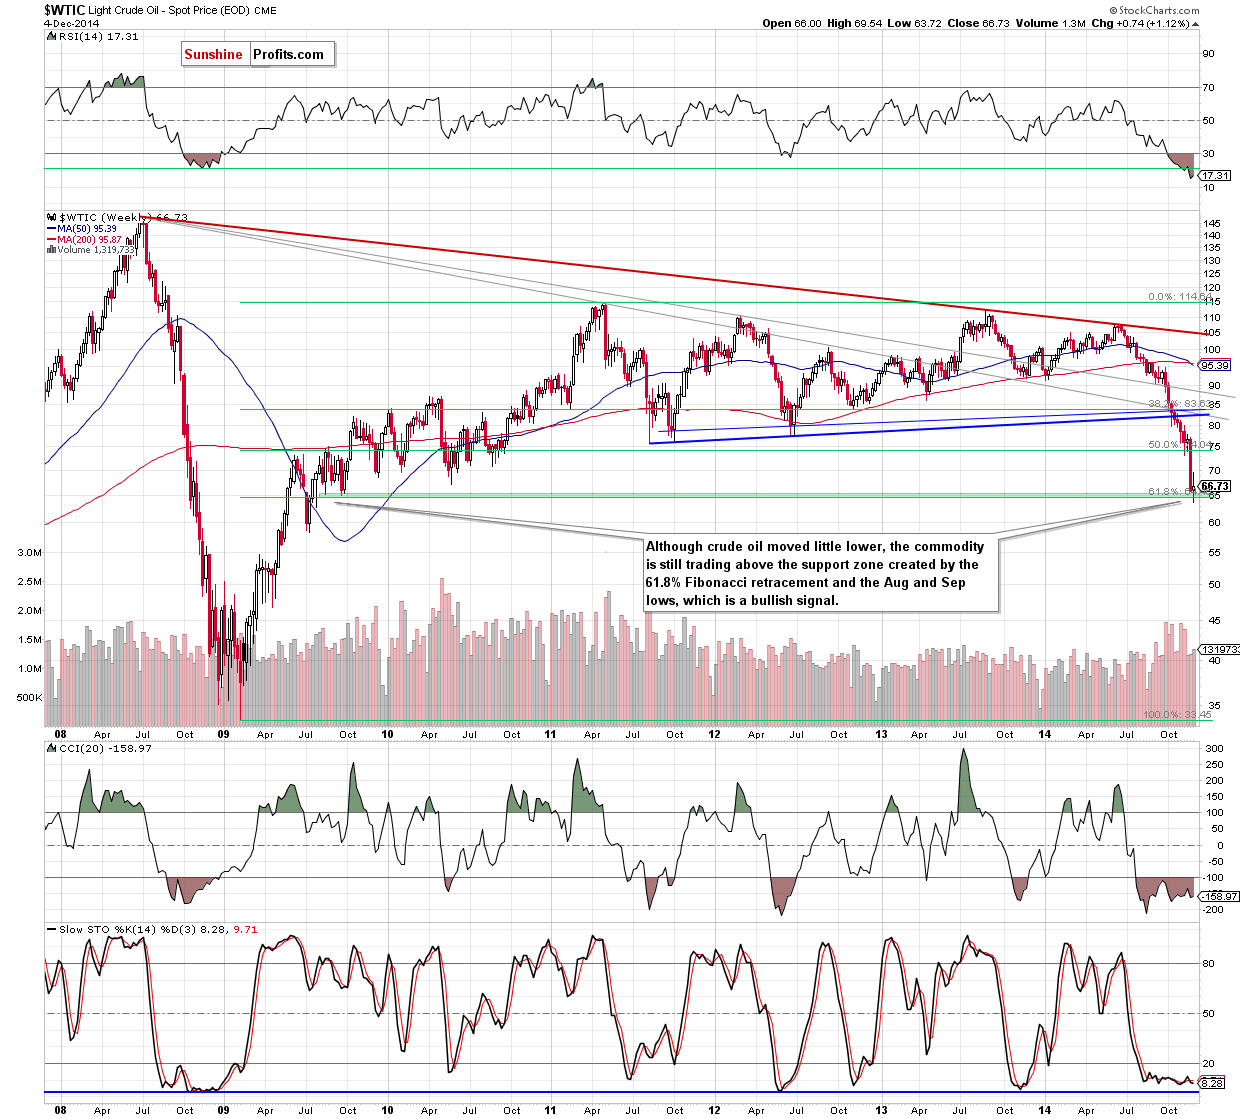
(…) Did this move change anything? Not really, because as long as the commodity is trading in a narrow range between the solid support zone (created by the 61.8% Fibonacci retracement and the Aug and Sep 2009 lows) and the 38.2% Fibonacci retracement, bigger upswing or downswing is not likely to be seen.
(…) please keep in mind that Monday’s upswing was much bigger ($5.82) than the previous ones and materialized on huge volume, which is a positive step toward the trend reversal. Nevertheless, as long as the key resistance is in play, another pullback and a test of the strength of the recent low is likely.
Before we summarize today’s alert, we would like to draw your attention to one of the interesting ratios from our yesterday’s Oil Investment Update.
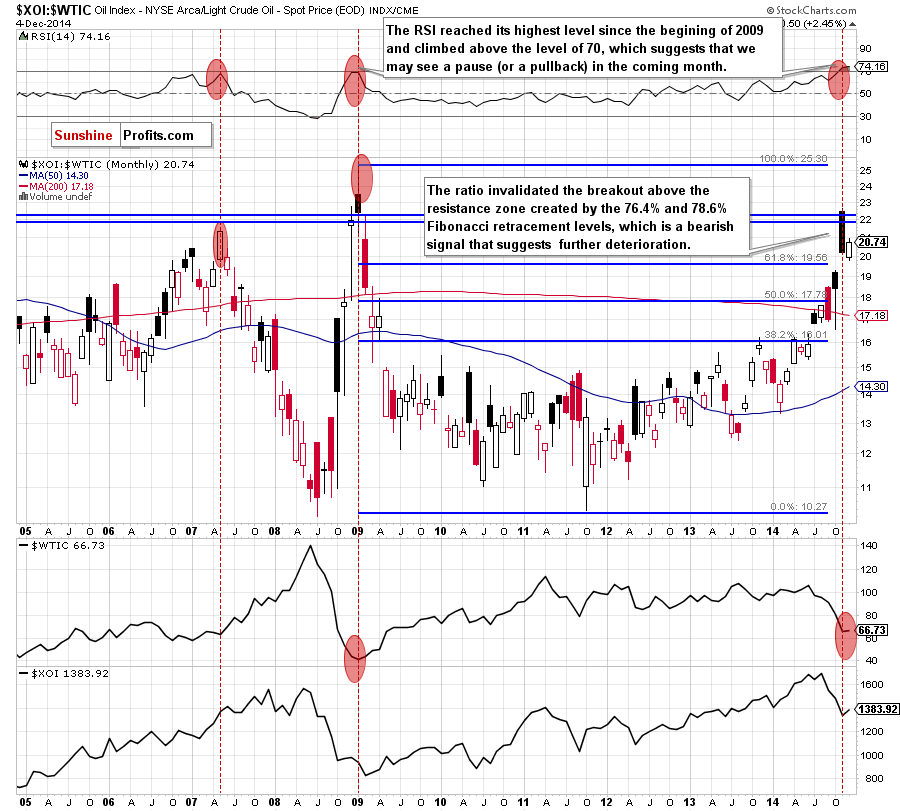
From the long-term perspective, we see that the ratio invalidated the breakdown above the resistance zone created by the 76.4% and 78.6% Fibonacci retracement levels. This is a bearish signal, which suggests further deterioration. What does it mean for crude oil? When you take a closer look at the above chart, you will see that may times in the past local tops in the ratio have corresponded to the crude oil’s lows. We saw such price actions many times in the previous years. Additionally, the RSI increased to its highest level since the beginning of 2009 and climbed above the 70 level, which suggests a pause or a pullback in the coming month. At this point, it’s worth noting that even lower readings of the indicator (in 2007 and 2009) preceded a sharp downward move in the ratio and an upward move in crude oil. Taking these facts into account, we think that we’ll see a corrective upward move in crude oil in the near future.
Can we infer something more from the weekly chart? Let’s find out.
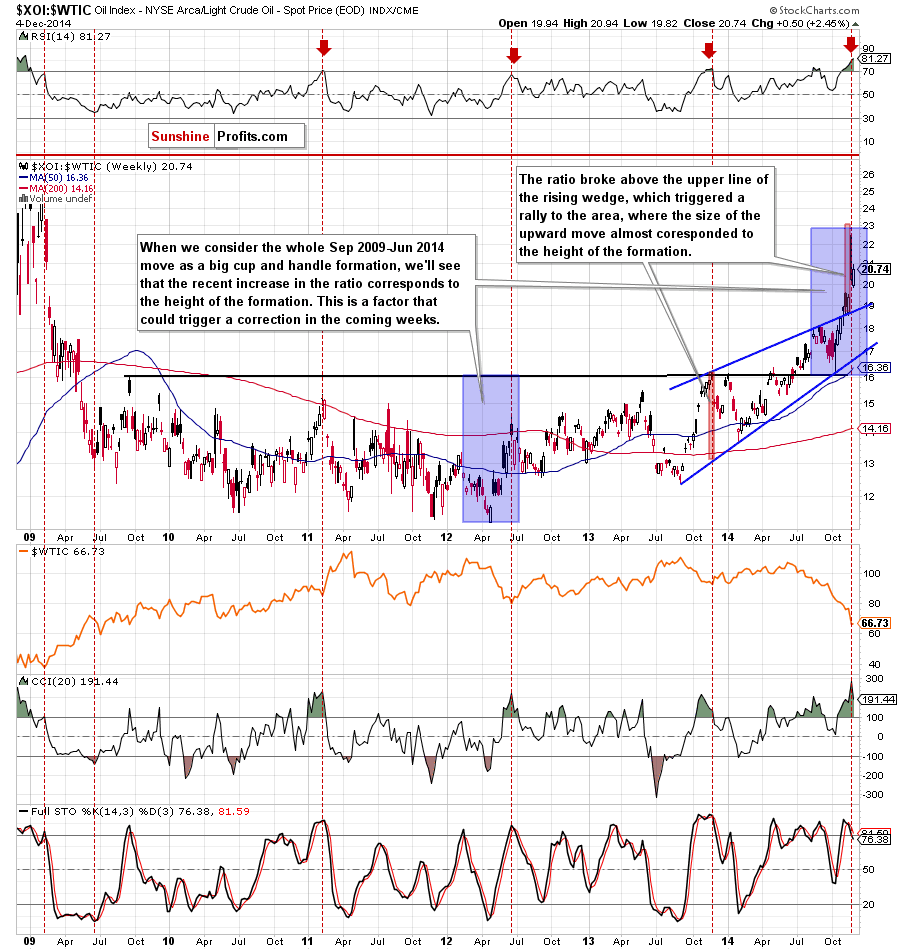
On the above chart, we see that the ratio reached the area, where the size of the upward move corresponds to the height of two technical formations: the rising wedge and the cup and handle pattern. This is a factor that may reduce the selling pressure and trigger a correction in the coming weeks. On top of that, the RSI reached its highest level since 2009 (above the level of 80), while the CCI and Stochastic Oscillator are overbought (the latter generated a sell signal). All the above provide us with bearish implications and suggests that further deterioration in the ratio is just around the corner. If this is the case, higher crude oil’s prices should not surprise us in the coming weeks.
Summing up, although crude oil moved lower once again, the overall situation is still unclear to open any positions. Additionally, as we have pointed out before, as long as the commodity is trading in a narrow range between the support and resistance lines, bigger upswing or downswing is not likely to be seen. Therefore, waiting on the sidelines waiting for the confirmation that the final bottom is in is the best choice at the moment.
Very short-term outlook: mixed with bullish bias
Short-term outlook: mixed
MT outlook: mixed
LT outlook: bullish
Trading position (short-term; our opinion): No positions are justified from the risk/reward perspective at the moment, however, if this week’s upward move won’t be followed by a fresh multi-year low and we’ll see a breakout above the 38.2% Fibonacci retracement (based on the recent downward move), we’ll consider opening long positions. Until this time, waiting on the sidelines for the confirmation that the final bottom is in is the best choice. We will keep you informed should anything change.
Thank you.
Nadia Simmons
Forex & Oil Trading Strategist
Przemyslaw Radomski, CFA
Founder, Editor-in-chief
Gold & Silver Trading Alerts
Forex Trading Alerts
Oil Investment Updates
Oil Trading Alerts

