
Trading position (short-term; our opinion): Speculative short positions in crude oil seem to be justified from the risk/reward perspective.
On Monday, crude oil climbed above $100 per barrel supported by the upbeat U.S. service sector data. Despite this improvement, the commodity reversed and lost 0.54% as weaker-than-expected economic data from major crude consumer China weighted on investors’ sentiment. In this way, light crude closed the day below the psychological barrier for the fourth time in a row. Is it enough to trigger another sizable downswing?
Yesterday, the Institute of Supply Management showed that its non-manufacturing purchasing managers' index climbed to a 5-month high of 55.2 in the previous month, beating expectations for an increase to 54.1. In reaction to this news, crude oil moved higher and increased above the psychological barrier of $100.
However, as it turned out in the following hours, a weak Chinese manufacturing report (released earlier on Monday) outweighed this better-than-expected U.S. service sector data. HSBC's manufacturing purchasing managers' index for China posted a reading of 48.1 for April, missing expectations for an increase to 48.4. At this point, it’s worth noting that a reading below 50 indicates an economic contraction, which is a bearish signal for oil demand because China is the world's second-largest crude consumer behind the U.S. Therefore, disappointing numbers pushed the price lower.
Once we know two major fundamental factors that affected the commodity yesterday, let’s take a look at the technical picture of crude oil (charts courtesy of http://stockcharts.com.)
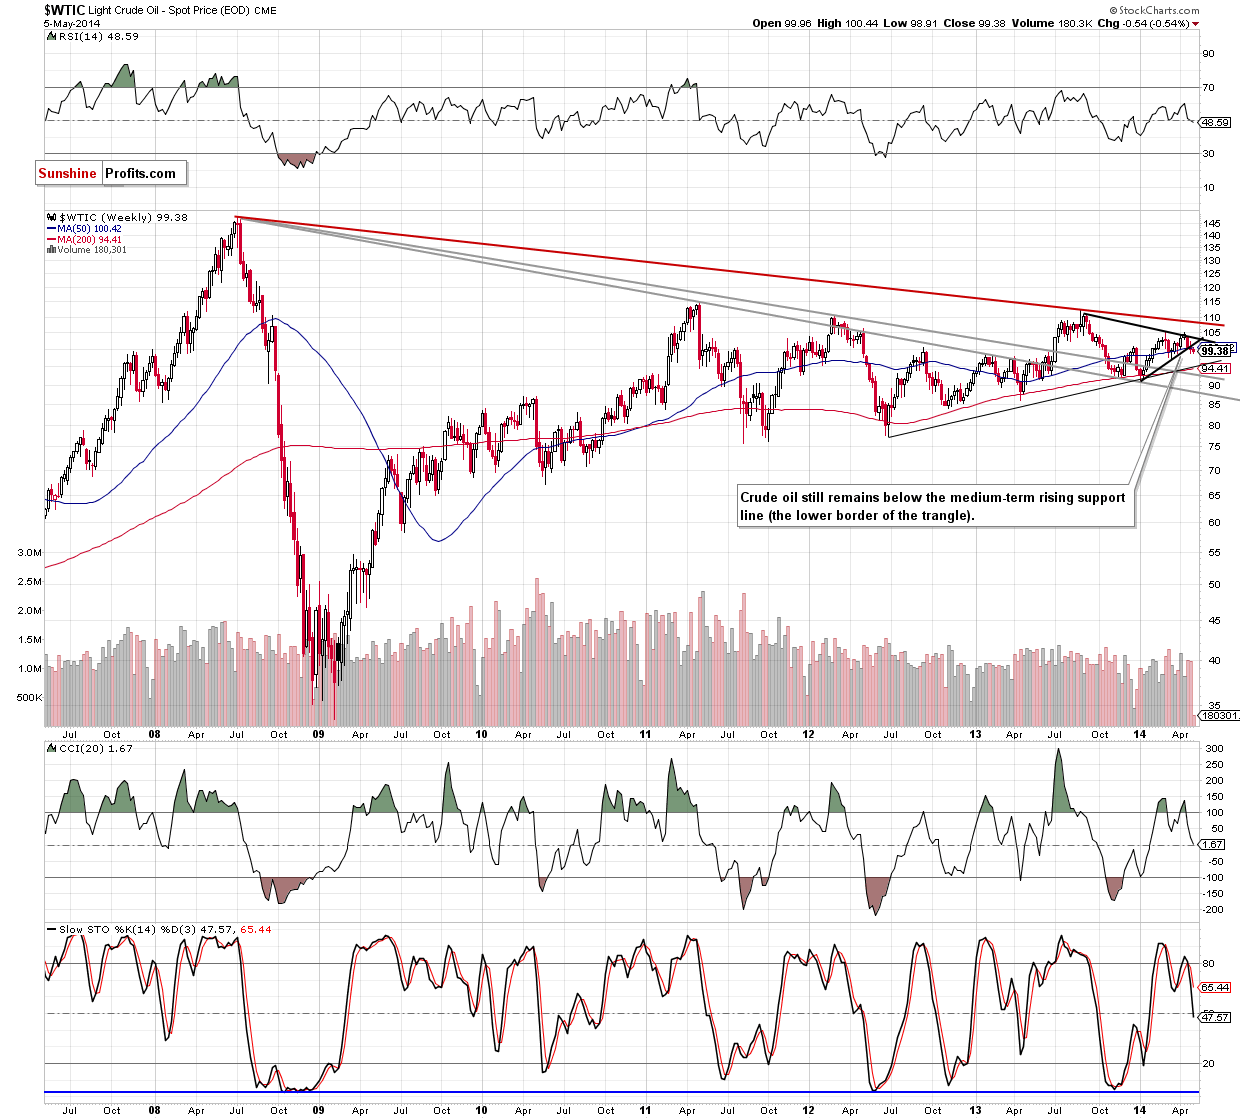
Looking at the weekly chart, we clearly see that the situation hasn’t changed much as crude oil still remains below the lower border of the triangle, the psychological barrier of $100 and the 50-week moving average. Therefore, the bearish scenario from our Oil Trading Alert posted on Wednesday is up-to-date:
(…) if the commodity extends losses and drops below the psychological barrier of $100, we will likely see further deterioration and a drop even to around $95, where the medium-term support line (based on the June 2012 and January 2014 lows) is. At this point, it’s worth noting that the CCI and Stochastic Oscillator generated sell signals, which suggests that another attempt to move lower should not surprise us.
Once we know the situation from the weekly perspective, let’s zoom in on our picture and move on to the daily chart.
Quoting our previous Oil Trading Alert:
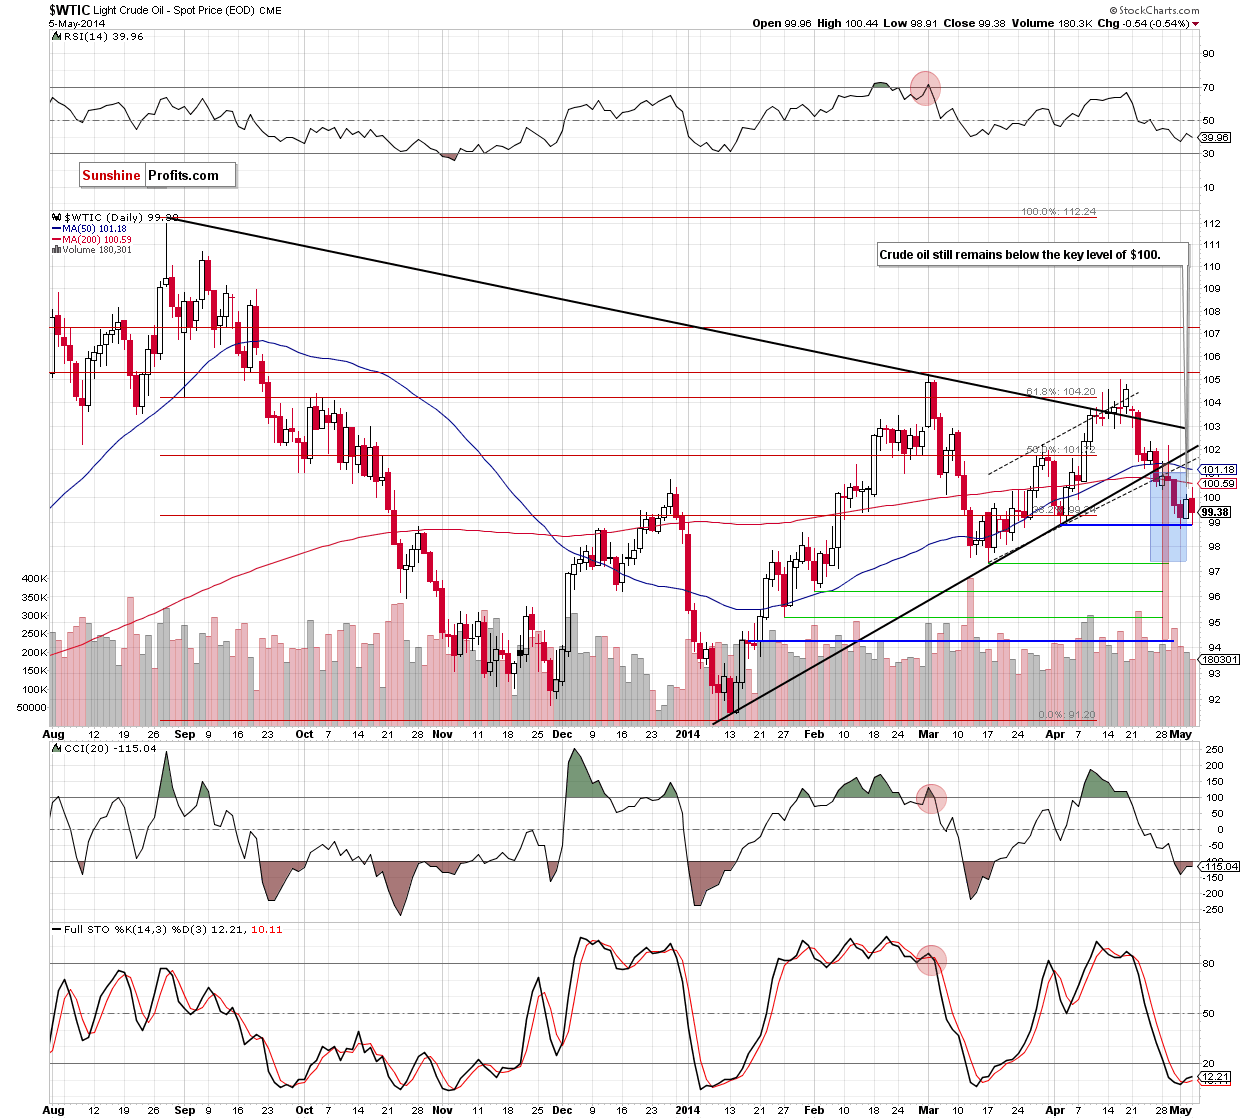
(…) all bearish factors that we noticed in the previous week (a confirmed breakdown below the the lower border of the medium-term triangle, the lower border of the short-term trend channel and the psychological barrier of $100) remain in place and still support the bearish case. (…) the breakdown in the USO ETF is confirmed after Friday's session, which is an additional negative sign. Therefore, we think that another attempt to move lower and test the strength of the nearest support level should not surprise us.
As you see on the above chart, we noticed such price action yesterday. Although crude oil showed some “strength” after the market’s open and moved (very temporarily) above $100, the price didn’t even reach the previously-broken 200-day moving average. In reaction to this, oil investors pushed the sell button, which triggered a pullback that took the commodity to an intraday low of $98.91. In this way, light crude dropped to the bottom of the correction that we saw at the turn of March and April once again. If history repeats itself and this support level holds, we may see a corrective upswing in the coming days and the first upside target will be the above-mentioned 200-day moving average (currently at $100.59). However, if crude oil drops below Thursday low, we think that the price will likely drop to one of downside targets that we discussed in our previous Oil Trading Alert:
(…) In the case of the breakdown under the lower border of the trend channel, declines may push the price to around $97, where the size of the downswing will correspond to the height of the formation. Nevertheless, in our opinion, the confirmation of the breakdown below the medium-term line is more important because it suggests an even bigger move. In this case, the correction may be deeper and take light crude to around $94.20. At this point, it’s worth noting that the first downside target is supported by the March low of $97.37 and the latter corresponds to the 78.6% Fibonacci retracement based on the entire Jan.-March rally.
Summing up, although crude oil climbed above $100, this improvement was only very temporarily and didn’t change anything in the very short-term picture. The commodity reversed and still remains below the previously-broken important resistance lines and the key level of $100. Taking into account the fact that all bearish signals remain in place, in our opinion, further deterioration in the coming days is likely.
Very short-term outlook: bearish
Short-term outlook: bearish
MT outlook: mixed
LT outlook: mixed
Trading position (short-term): Short. Stop-loss order: $102.50. We will keep you informed should anything change, or should we see a confirmation/invalidation of the above.
Thank you.
Nadia Simmons
Forex & Oil Trading Strategist
Przemyslaw Radomski, CFA
Founder, Editor-in-chief
Gold & Silver Trading Alerts
Forex Trading Alerts
Oil Investment Updates
Oil Trading Alerts

