
Trading position (short-term; our opinion): Long positions with a stop-loss order at $89 are justified from the risk/reward perspective.
On Thursday, crude oil hit a fresh multi-month low after the International Energy Agency cut its forecast for global oil demand. Nevertheless, later in the day, the commodity reversed and erased earlier losses as the European Union agreed to implement fresh sanctions on Russia. As a result, light crude gained 1.49% and closed the day above $93. Is there more strength on the way?
Yesterday, the International Energy Agency lowered its forecast for the rise in oil demand this year for the third month in a row, calling the recent slowdown in demand "nothing short of remarkable." The IEA said it expects global oil demand to grow by 900,000 barrels a day in 2014, a decrease of 65,000 barrels a day compared with last month’s forecast and down by 300,000 barrels a day since July. As a result, crude oil declined to its lowest level since May 2013, hitting an intraday low of $90.43.
Despite this drop, the commodity rebounded sharply later in the day as the European Union agreed to implement its new package of sanctions on Russia. The new sanctions will expand the number of Russian companies unable to raise new money in the bloc's capital markets. Additionally, three oil companies: Gazpromneft, Transneft and Rosneft will be forbidden from raising funds of longer than 30 days' maturity, while three companies involved in military production: Oboronprom, United Aircraft Corp. and Uralvagonzavod will be barred from future EU fundraising. On top of that, the bloc is also broadening its ban on sales of so-called dual-use technologies to Russian customers and prevent European companies from providing services for deep-water oil exploration and production, Arctic oil exploration and production, as well as shale oil projects in Russia. Because of these circumstances, the price of light crude rallied to an intraday high of $93.44. Will we see further improvement in the coming days? (charts courtesy of http://stockcharts.com).
In our yesterday’s Oil Trading Alert, we wrote the following:
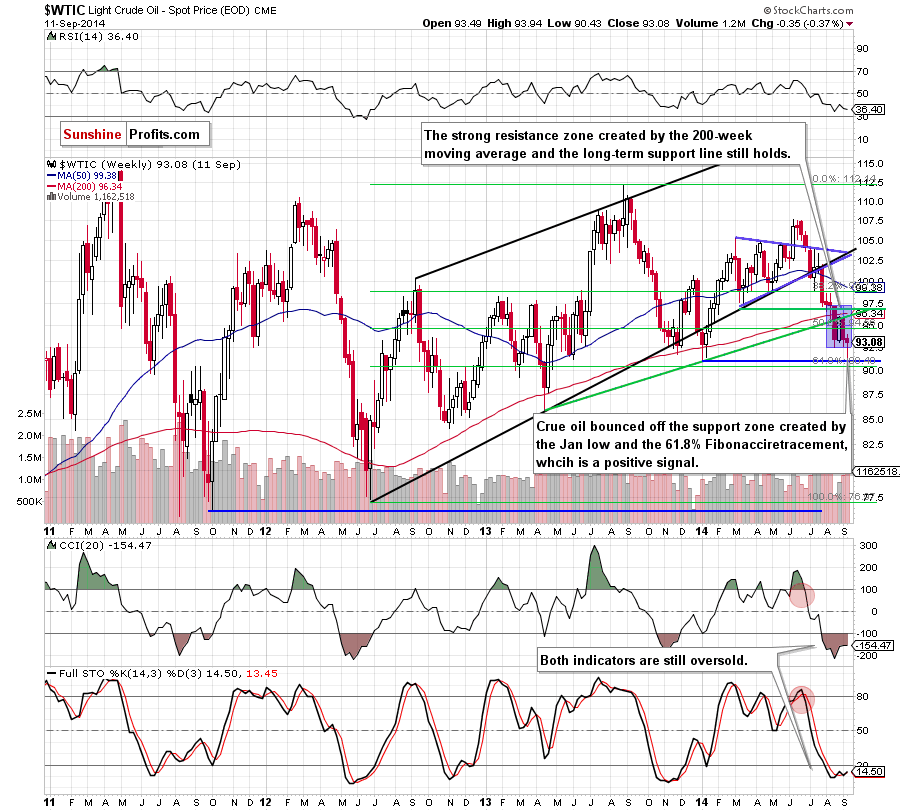
(…) crude oil is trading quite close to the long-term declining support line (marked with grey). What’s interesting, in this area (around $90) is also the (…) 61.8% Fibonacci retracement, which together create a solid support zone that could pause (or even stop) further deterioration. Taking into account the importance of this area, it seems to us that oil bulls do not give up so easily and will fight for it in the coming week.
As you see on the above charts, the situation developed in line with the above-mentioned and crude oil bounced of this strong support area, coming back to the medium-term consolidation. In this way, the commodity invalidated a breakdown below the lower border of the formation. Taking this positive signal into account, it seems to us that we’ll see further improvement in the coming week (especially if crudeoil closes this week above the lower line of the consolidation). Therefore, our last commentary is up-to-date:
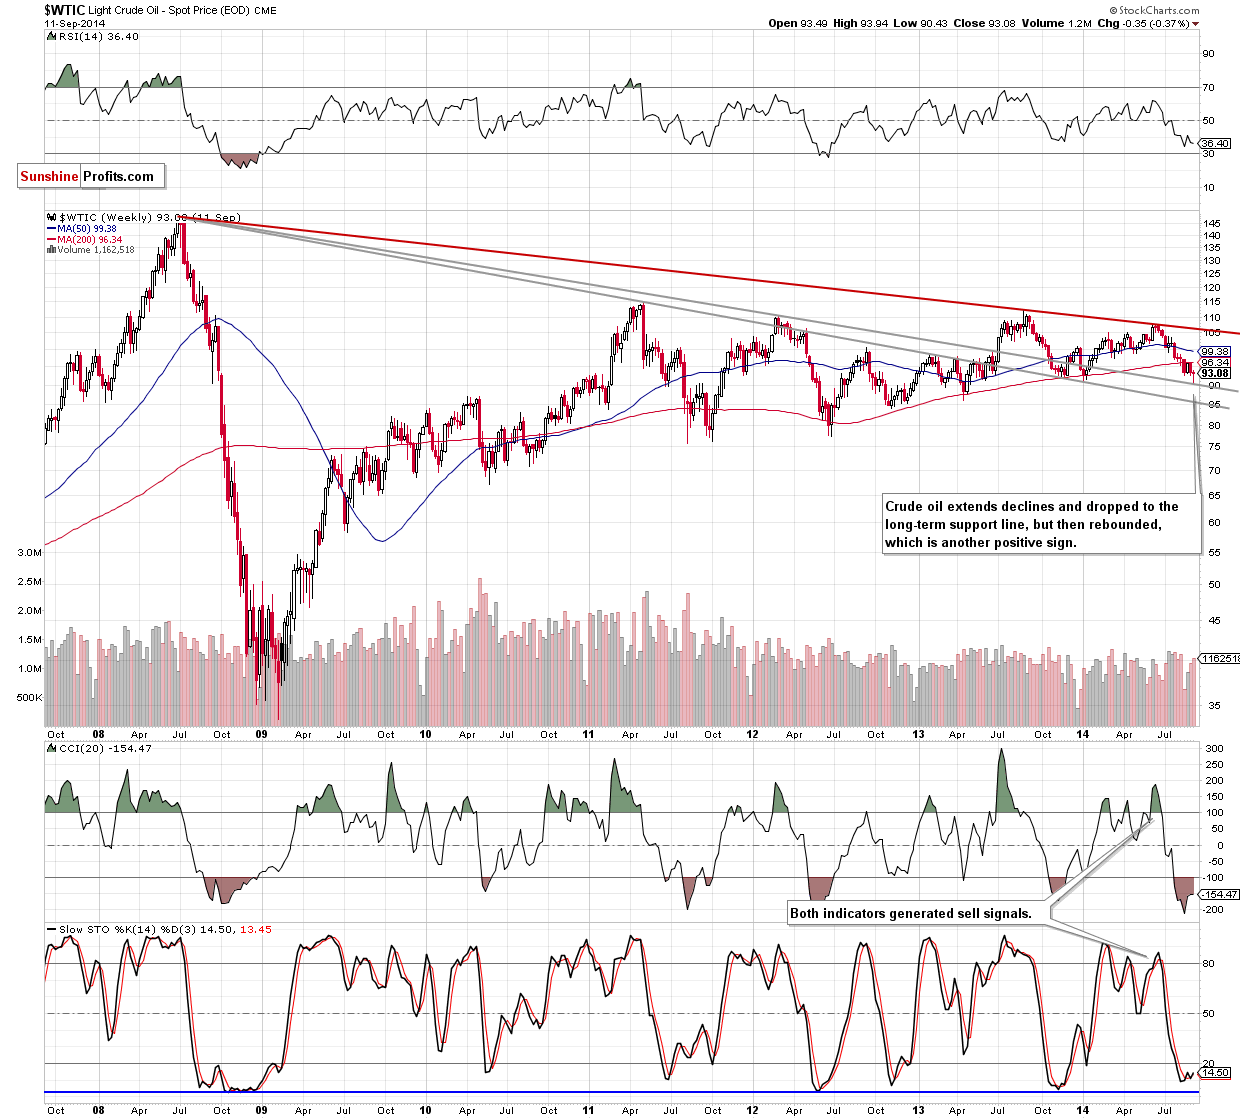
(…) crude oil will rebound to at least the strong resistance zone created by the previously-broken 200-day moving average and the long-term support/resistance green line seen on the first chart.
Once we know the medium-term picture, let’s check the daily chart.
Quoting our previous Oil Trading Alert:
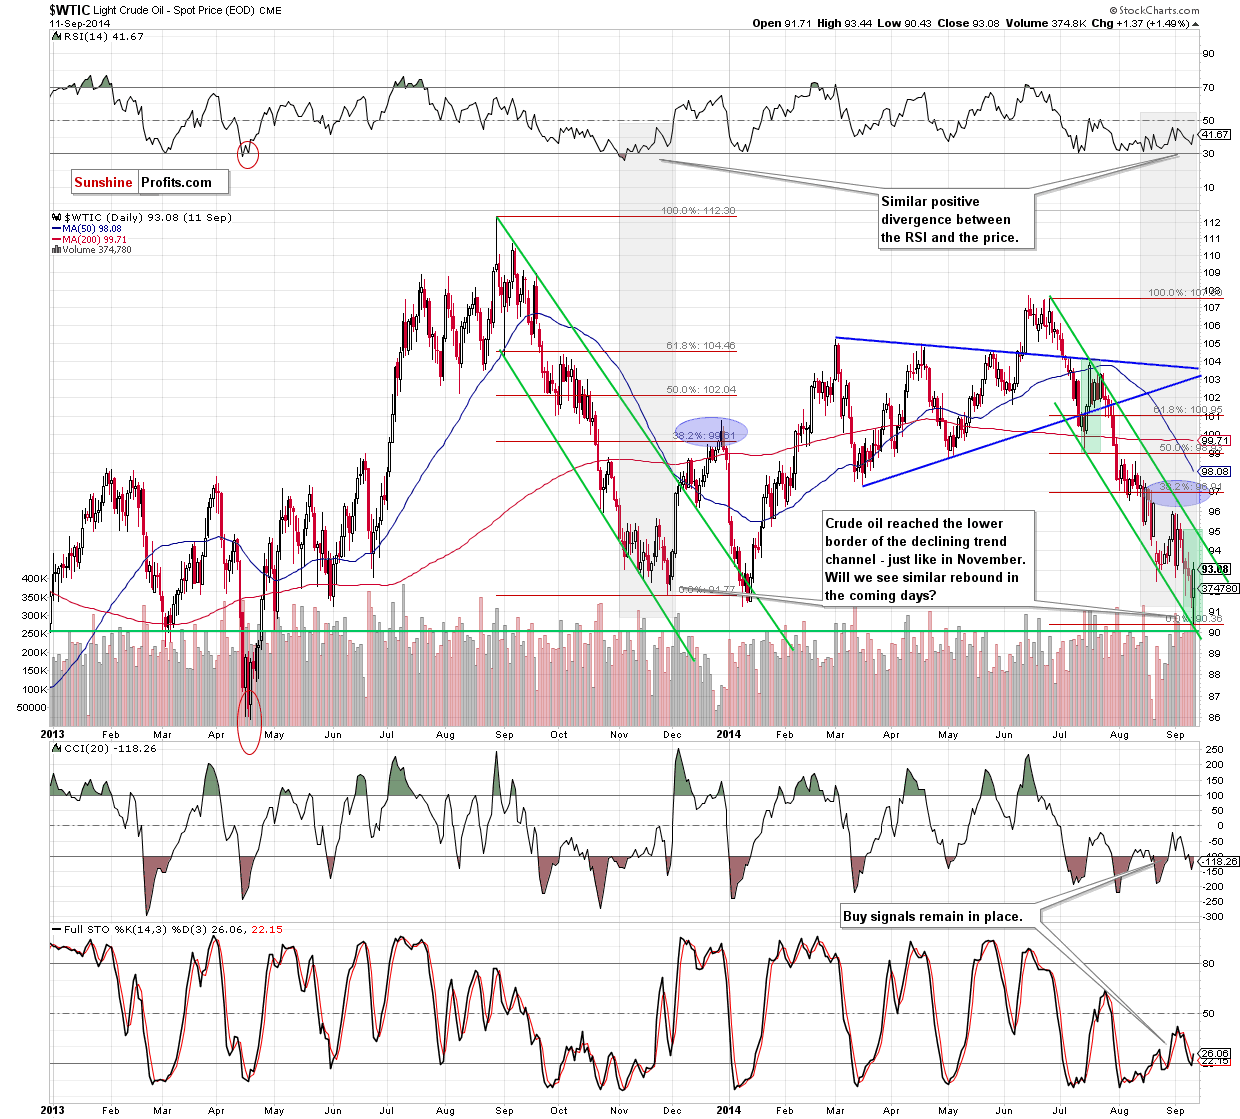
(…) Although yesterday’s drop is barely visible from the daily perspective, it shows that oil bulls are quite weak, which may result in a drop to the lower border of the declining trend channel (currently around $90). (…) this area is also reinforced by the support level based on the May 2013 low (and the support zone that we discussed earlier). Taking this fact into account, we think that even if crude oil moves lower, the space for further declines is limited. (…) there is also a positive divergence between the RSI and the price. (…) there was a similar situation in November. Back then, such circumstances preceded a sharp increase in the following days. Therefore, all the above provides us with bullish implication and suggests that corrective upswing is just around the corner.
Looking at the above chart, we clearly see that crude oil reached our downside target and bounced it off in the following hours. This is a bullish signal, which suggests that we would see further improvement in the coming days. The reason? When we take a closer look at the above chart, we see that the current situation is similar to the one that we saw in November. Back then, the above-mentioned positive divergence between the RSI and the price in combination with the lower border of the declining trend channel encouraged oil bulls to act and resulted in a sharp increase in the following days. Taking this fact into account, we think that the next bigger move will be to the upside and crude oil could rally to the 38.2% Fibonacci retracement based on the entire Jun-Sep decline (around $97). Nevertheless, before we see a realization of this scenario oil bulls will have to push the commodity above the upper line of the declining trend channel (currently around $94.50).
Summing up, strong support zone (created by the long-term declining support line, the 61.8% Fibonacci retracement level based on the Jun 2012-Aug 2013 rally, the lower border of the declining trend channel and the May 2013 low), which is a bullish signal. Taking this fact into account and combining it with all similarities to November, we think that opening long positions is justified from the risk/reward perspective at the moment.
Very short-term outlook: bullish
Short-term outlook: mixed with bullish bias
MT outlook: bearish
LT outlook: mixed
Trading position (short-term): In our opinion, opening long positions with a stop-loss order at $89 is justified from the risk/reward perspective. We will keep you informed should anything change, or should we see a confirmation/invalidation of the above.
Thank you.
Nadia Simmons
Forex & Oil Trading Strategist
Przemyslaw Radomski, CFA
Founder, Editor-in-chief
Gold & Silver Trading Alerts
Forex Trading Alerts
Oil Investment Updates
Oil Trading Alerts

