
Trading position (short-term; our opinion): No positions are justified from the risk/reward perspective.
Although crude oil moved lower after the market’s open, hitting a fresh multi-year low, the commodity rebounded supported by the EIA weekly report, which showed that crude supplies fell. Thanks to this data, light crude gained 1.54% and approached the previously-broken level of $50. Is it enough to trigger further improvement?
Yesterday, the ADP report showed that non-farm private employment rose by 241,000 in December, beating expectation for an increase of 226,000. Additionally, data showed that the U.S. trade deficit narrowed to $39.00 billion in November from $42.25 billion in October, also beating analysts’ expectations. These bullish numbers supported the price of crude oil, adding to expectations that the U.S. economy remained resilient amid slowing global growth.
Additionally, later in the day, the U.S. Energy Information Administration showed in its weekly report that U.S. crude oil inventories decreased by 3.1 million barrels in the week ended January 2, beating expectations for an increase of 0.9 million barrels. This better-than-expected data pushed the commodity to an intraday high of $49.31. Despite this improvement, light crude reversed as it found out that supplies of refined petroleum products rose more than expected last week (gasoline inventories increased by 8.1 million barrels, above expectations for a gain of 3.4 million, while distillate stockpiles rose by 11.2 million barrels). Will crude oil move lower once again? (charts courtesy of http://stockcharts.com).
Quoting our previous Oil Trading Alert:
(…) the recent declines materialized on rising volume, which confirms oil bears’ strength. Taking this fact into account, we think that another attempt to move lower and test of the strength of the lower border of the support zone marked on the weekly chart (at $46.72) is likely. In our opinion, this scenario will be even more likely if today’s the EIA weekly report shows another increase in crude oil inventories (…). Nevertheless, (…) a smaller-than-expected increase or a decline will support the price and trigger a corrective upswing. In this case, the initial upside target would be the previously-broken level of $50.
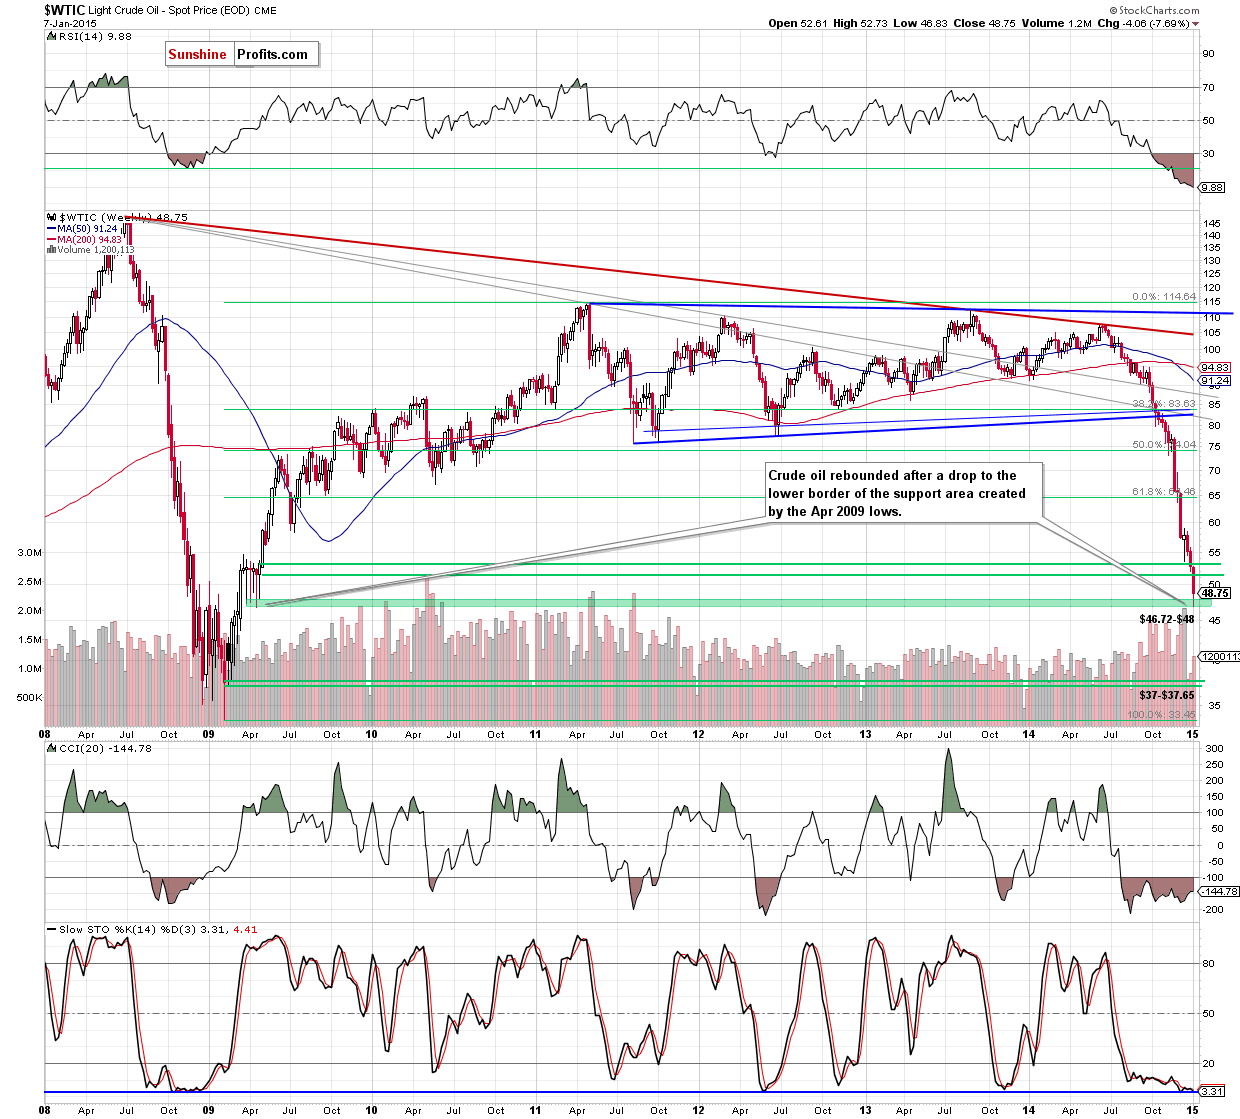
Looking at crude oil from the medium-term perspective, we see that the situation developed in line with the above-mentioned scenario and the commodity rebounded after a drop to the lower border of the support zone (marked with green) created by the Apr 2009 lows. Although this is a positive signal, we should keep in mind that light crude is still trading below the previously-broken level of $50. What doest it mean for the commodity? Let’s take a closer look at the daily chart and find out.
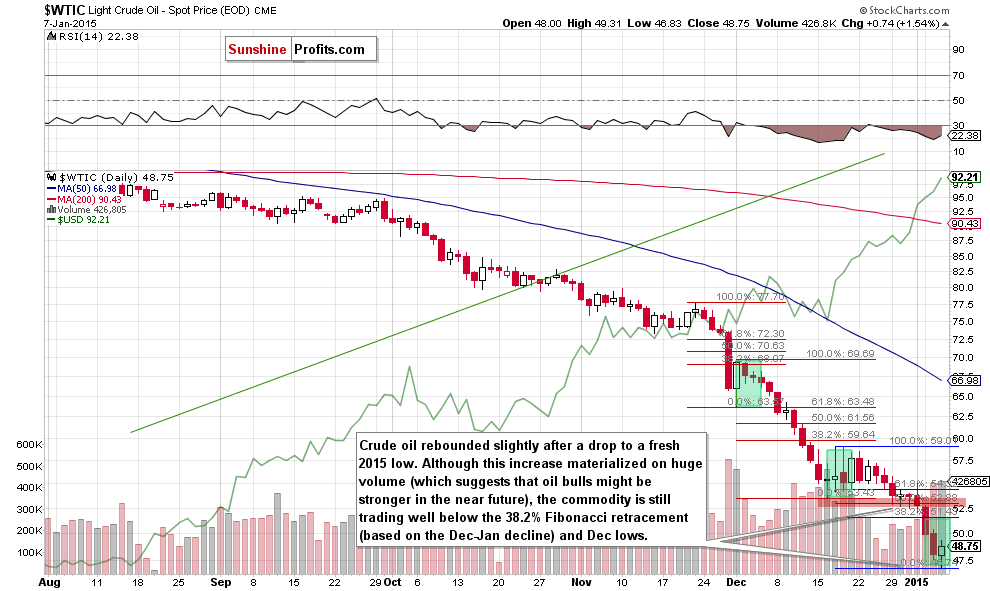
On the above chart, we see that although yesterday’s upswing materialized on huge volume (which suggests that oil bulls might be stronger in the near future), the commodity is still trading well below the 38.2% Fibonacci retracement (based on the Dec-Jan decline) and the Dec lows. As you see on the daily chart, we saw similar situation in mid-Dec. Back then, a rebound confirmed by huge volume resulted in a doji candlestick, which triggered only a short-lived corrective upswing that took crude oil to the first important Fibonacci resistance. Despite this increase, oil bulls were unable to push the commodity higher (similarly to what we noticed at the beginning of Dec), which translated to a fresh multi-year low. Taking all the above into account, we think that as long as there is no bigger upswing (bigger than $5.85, which won’t be followed by a fresh multi-year low) and a successful breakout above the 38.2% Fibonacci retracement (based on the Dec-Jan decline), a sizable upward move is not likely to be seen and another test of the lower border of the support zone (at $46.72) can’t be ruled out. At this point you may ask what could happen if light crude drops below this support. In our opinion, the best answer to this question will be the long-term chart.
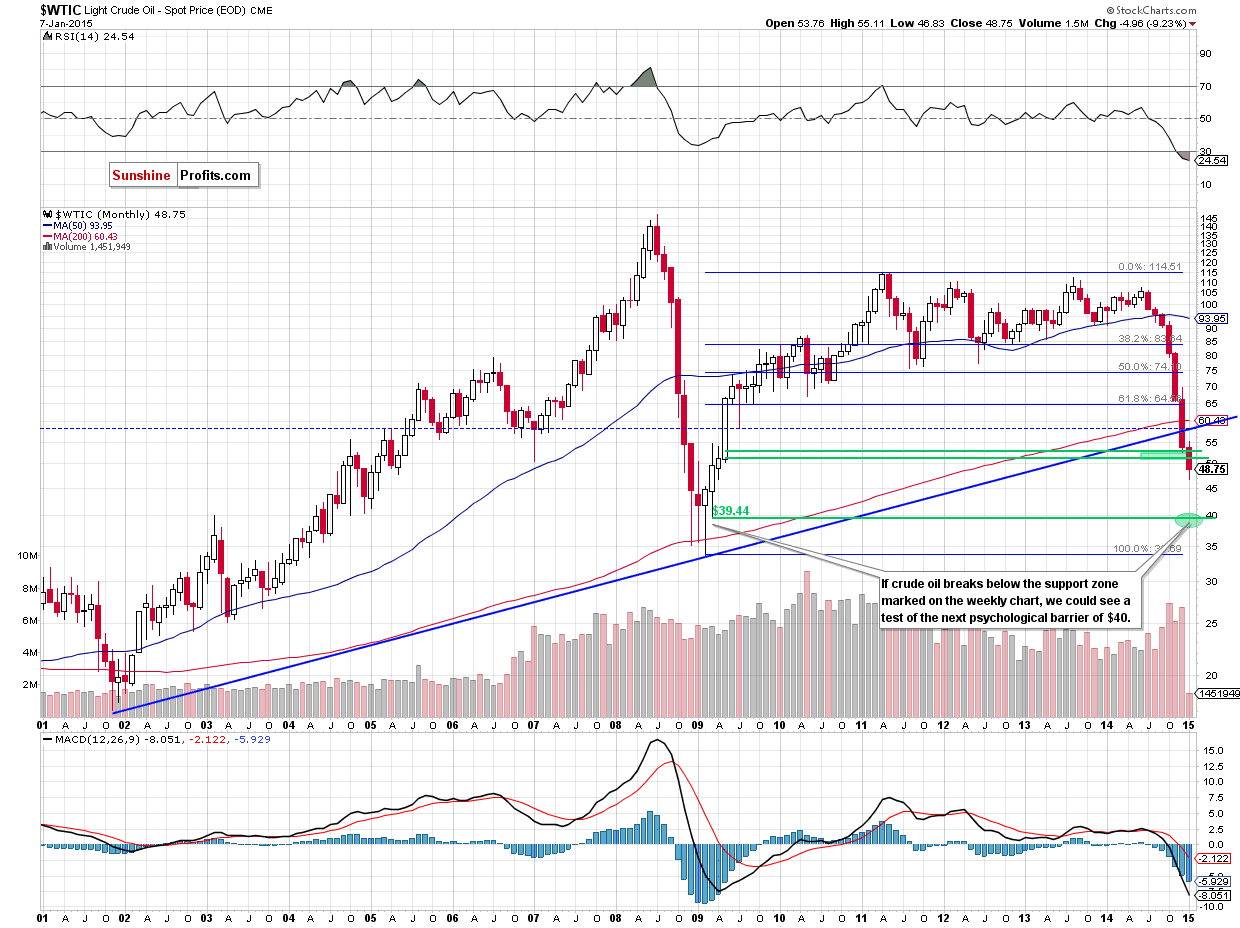
As you see on the monthly chart, if crude oil extends losses, we could see a test of the strength of the next psychologically important barier of $40 in the coming month (this area is supported by the Mar 2009 low of $39.44).
Summing up, crude oil moved lower once again and almost touched the lower border of the support zone based on the Apr lows. Despite this drop, the commodity rebounded later in the day, but is still trading below the 38.2% Fibonacci retracement (based on the Dec-Jan decline) and the Dec lows. Taking this fact into account, and combining it with price action that we saw in the previous month (two unsuccessful attempts to break above this first important Fibonacci resistance), we believe that as long as there is no bigger upswing (bigger than $5.85, which won’t be followed by a fresh multi-year low) and a successful breakout above the 38.2% Fibonacci retracement, a sizable upward move is not likely to be seen and another test of the lower border of the support zone (at $46.72) can’t be ruled out.
Very short-term outlook: mixed
Short-term outlook: mixed
MT outlook: mixed
LT outlook: bullish
Trading position (short-term; our opinion): No positions are justified from the risk/reward perspective at the moment, but we will keep you informed should anything change.
Thank you.
Nadia Simmons
Forex & Oil Trading Strategist
Przemyslaw Radomski, CFA
Founder, Editor-in-chief
Gold & Silver Trading Alerts
Forex Trading Alerts
Oil Investment Updates
Oil Trading Alerts

