
Trading position (short-term; our opinion): No positions are justified from the risk/reward perspective.
On Friday, crude oil bounced off the recent low and gained 7.31% after oil investors digested the Baker Hughes‘report. Thanks to this increase, the commdity invalidated the breakdown under important support levels. Does it mean that the worst is behind oil bulls?
On Friday, oil-field services company Baker Hughes reported that the number of domestic drilling rigs fell 7% for the week, bringing the count to 1,223, which is the lowest level in three years. In these cirumstances, the price of crude oil moved sharply higher, hitting an intraday high of $48.35. Did this rally change the short-term picture of the commodiy?(charts courtesy of http://stockcharts.com.
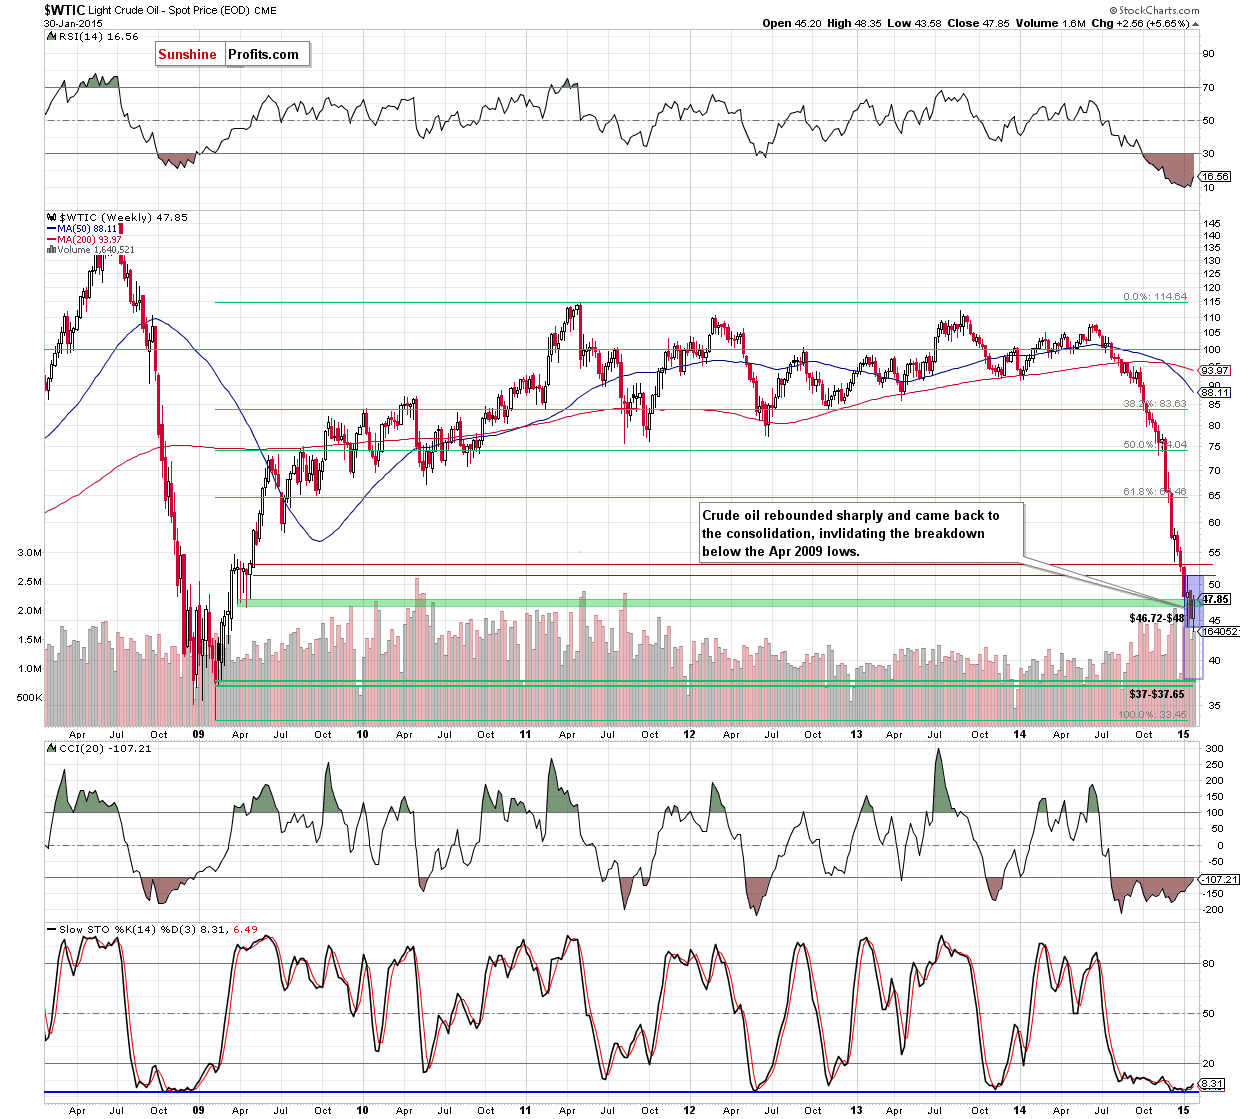
Looking at the above chart, we see that crude oil bounced off the recent low and increased sharply, invalidating not only the breakdown below the previous low, but also under the Apr 2009 lows. This is a positive signal, which suggests further improvement, but is this move as bullish as it seems at the first sight? Let’s take a look at the daily chart.
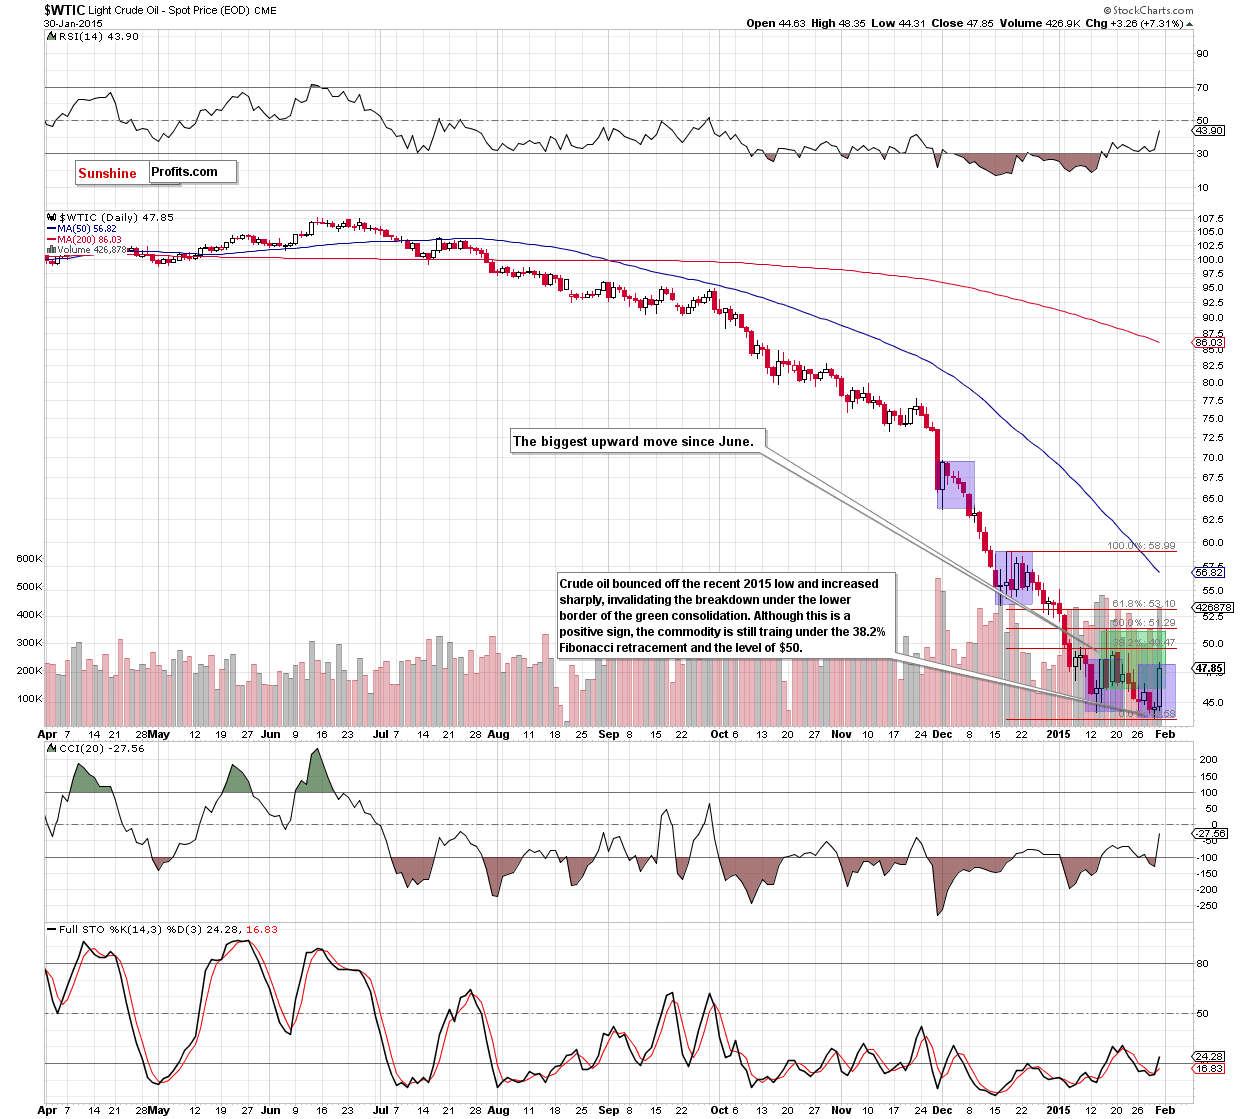
From this perspective, we see that Friday’s rally invalidated the breakdown below the lower border of the consolidation (marked with green), which is another bullish signal. On top of that, the CCI and Stochastic Oscillator generated buy signal, while the size of volume that accompanied this increase was significantly, which suggests that oil bulls are getting stronger. Without a doubt, these are positive circumstances favoring further growth and an increase to the 38.2% or even 50% Fibonacci retracement (based on the Dec-Jan decline).
Nevertheless, we should keep in mind that Friday’s rally is similar to upswings that we saw in the previous weeks (marked with blue) and smaller than the recent upward move (between Jan 13 and Jan 15). What does it mean for crude oil? In all previous cases, although such price action looked inviting and suggested further improvement, it turned out that it was nothing more than the next stop before new lows. Therefore, with the above in mind, we believe that a reliable trend reversal and a sizable upward move to (at least) Dec highs around $60 will be likely only if we see a breakout above the solid resistance zone (created by the previously-broken 76.4% and 78.6% Fibonacci retracement levels marked with green on the weekly chart, the 50% Fibonacci retracement based on the mid-Dec-Jan decline and the Jan 15 high), which won’t be followed by a fresh low. Until this time, another attempt to move lower can’t be ruled out (even if crude oil shows further strength later today or in the coming days).
Summing up, crude oil rebounded sharply, invalidating the breakdown below the lower border of the consolidation (marked with green on the daily chart) and the Apr 2009 lows. Although these are bullish circumstances, suggesting further rally to the 38.2% or even 50% Fibonacci retracement (based on the Dec-Jan decline), we think that as long as there is no comeback above the Jan 15 high, a trend reversal is questionable.
Very short-term outlook: mixed
Short-term outlook: mixed
MT outlook: mixed
LT outlook: bullish
Trading position (short-term; our opinion): No positions are justified from the risk/reward perspective at the moment. Nevertheless, if we see a successful breakout above the Jan 15 high of $51.27, we’ll consider opening long positions. We will keep you informed should anything change.
Thank you.
Nadia Simmons
Forex & Oil Trading Strategist
Przemyslaw Radomski, CFA
Founder, Editor-in-chief
Gold & Silver Trading Alerts
Forex Trading Alerts
Oil Investment Updates
Oil Trading Alerts

