

Trading position (short-term; our opinion): Short positions with a stop-loss order at $54.12 and initial (!) target price at $35.72 are justified from the risk/reward perspective.
Although U.S. oil rigs dropped for the first time in six weeks, crude oil declined and lost almost 2% on Friday. Does this show of weakness suggest lower values of the commodity in the coming week?
On Friday, Baker Hughes report showed that U.S. oil rigs for the week ending on Aug. 28 declined by 13 to 662, marking its first weekly decline since the start of the summer. Despite this positive signal, crude oil moved lower in the following hours and hit an intraday low of $45.61. Taking the above into account, and combining it with the fact that demand will likely continue to wane toward the end of the summer driving season, it seems that lower values of light crude are just around the corner. Will the technical picture of the commodity confirm this scenario? Let’s check (courtesy of http://stockcharts.com).
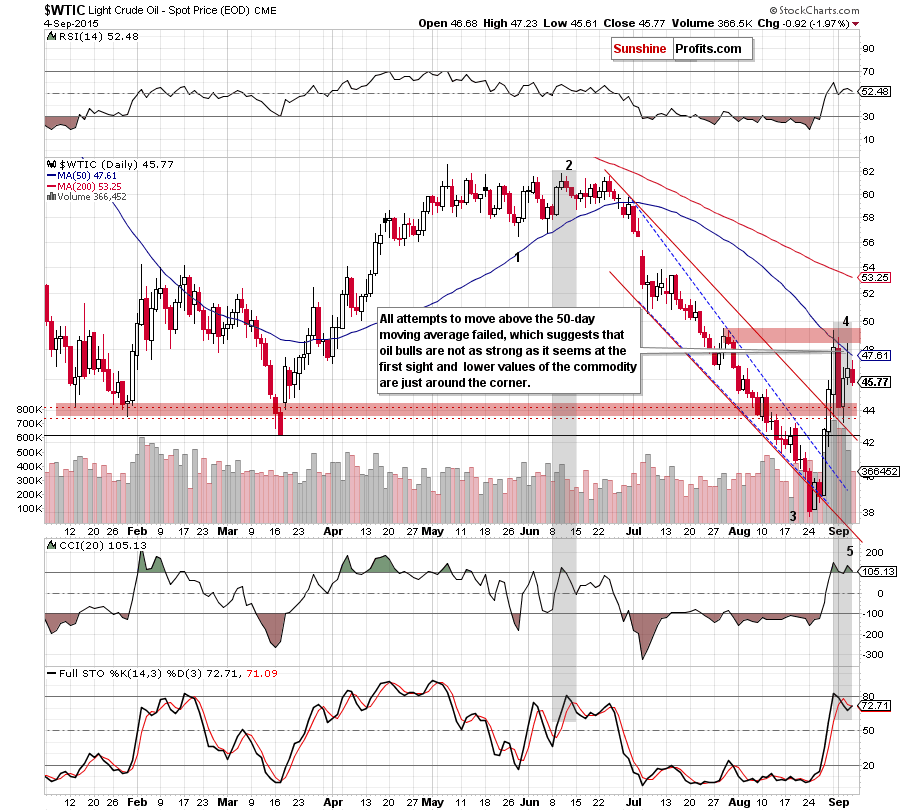
On the daily chart, we see that although there were several attempts to climb above the 50-day moving average, they all failed, which suggests that oil bulls are not as strong as it might seem at the first glance. On top of that, the CCI is overbought, while the Stochastic Oscillator reached its highest level since mid-Jun, which is an additional negative technical signal.
What impact did the recent price action have on the weekly chart? Let’s see.
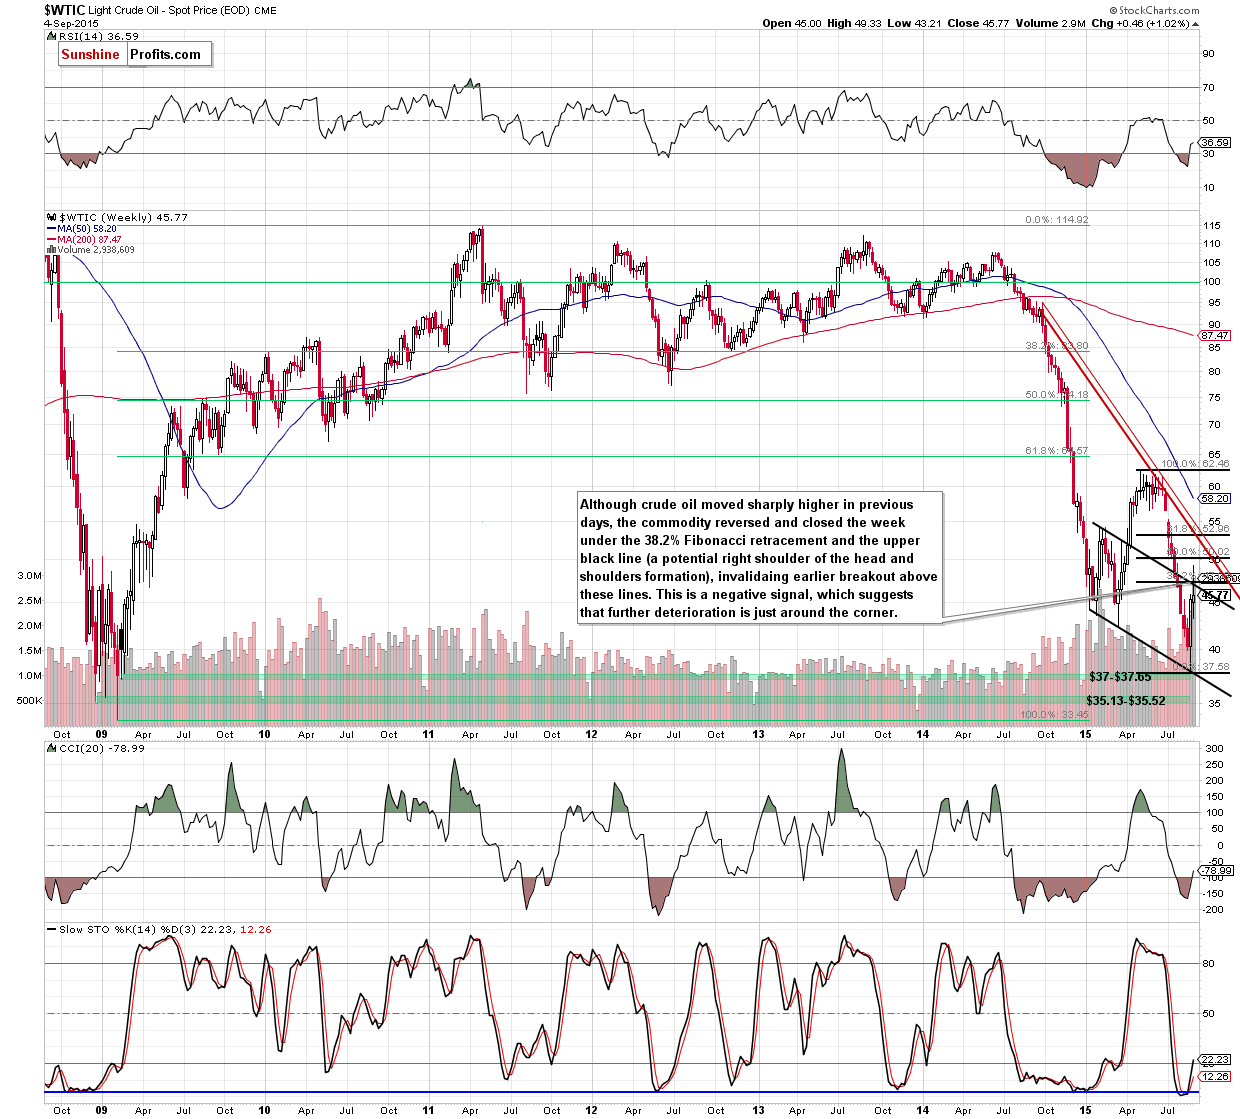
From this perspective, we see that although crude oil moved sharply higher in previous days, the commodity reversed and closed the week under the 38.2% Fibonacci retracement and also below the upper black support/resistance line (a potential right shoulder of the head and shoulders formation marked on the long-term chart), invalidating earlier breakout above these lines. This is another negative sign, which suggests that further deterioration should not surprise us.
Finishing today’s alert, we would like to draw your attention to our previous commentary and the long-term chart, which is the most important at the moment and very clearly justifies re-entering short positions.
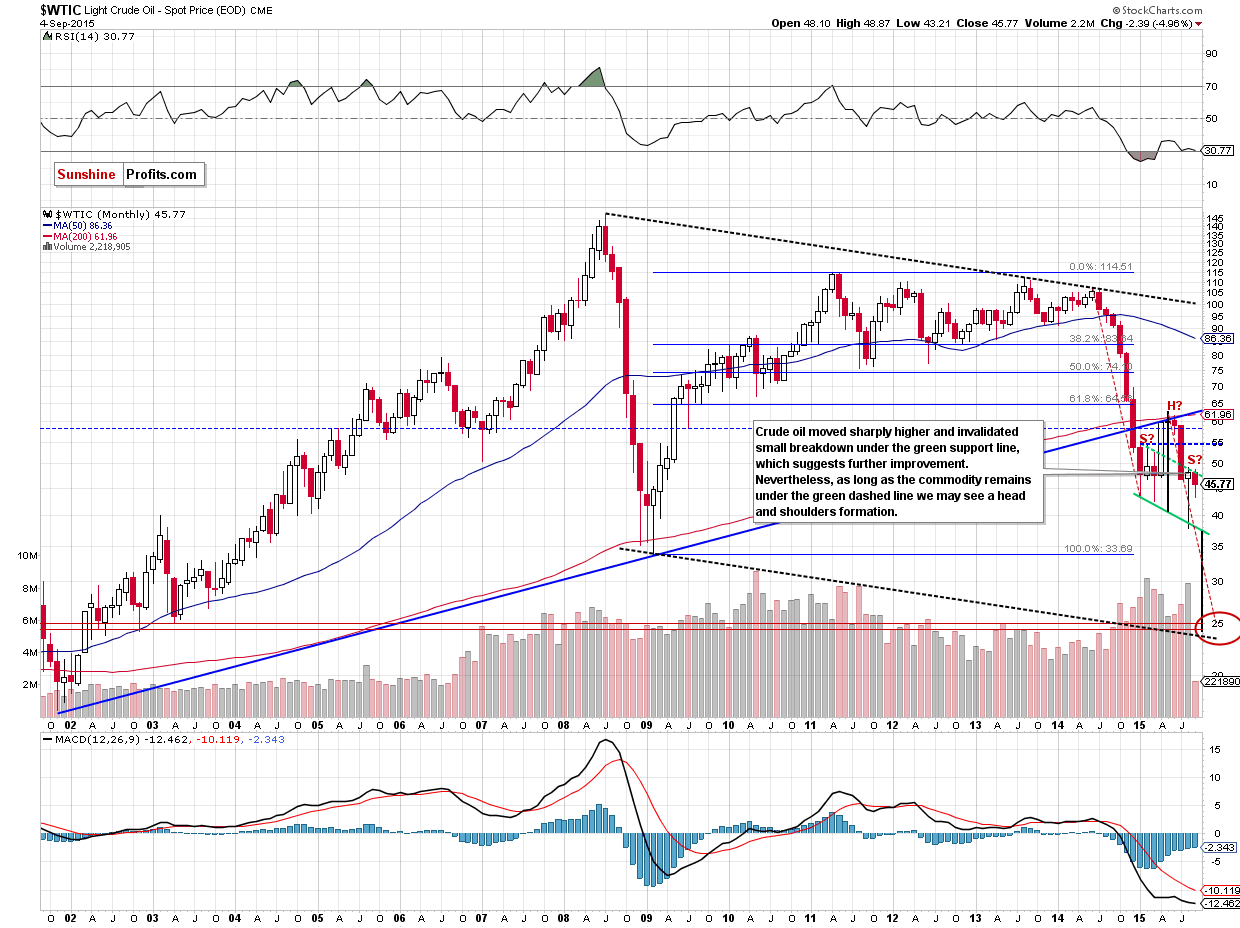
(...) it seems quite likely that crude oil will slide all the way down to more or less $25 dollars and there are multiple reasons for it:
- The breakdown below the key long-term rising support line (marked with blue) was confirmed and verified – this year’s rally didn’t take crude oil back above it – the line proved to be strong resistance. This by itself doesn’t imply a target level at a certain point, but it strongly suggests that crude oil has to fall much lower, before the decline is over.
- The symmetry of major declines: the 2008 slide is the only decline that is really similar to the current one, and in order for this similarity to be upheld (history repeats itself to a considerable extent), crude oil would have to move even a bit below $25. On the above chart you can see that in the form of the declining dashed black lines.
- The symmetry between the 2014 slide and the (likely) current decline. This year we have definitely seen some kind of consolidation (which might still turn out to be a bottom, but that is unlikely in our view) and the move that follows a consolidation is very often similar to the one that preceded it. If you look at the red dashed declining lines on the above chart you’ll notice that for the previous decline to repeat, crude oil would have to move to about $25.
- Speaking of the consolidation, it’s taking the form of a head-and-shoulders pattern and once / if the pattern is completed, we will have a pattern-based target at around $25. The reason is that once price breaks below the “neck level”, it’s likely to decline as much as the size of the “head” in the pattern.
- The late-2002 and 2003 bottoms create strong support at those levels.
The amount of signals that points to $25 as the most likely target is uncanny, which makes it quite reliable.
Yes, there also are the 2008 and 2009 lows, but generally not much (if anything) confirms them as a major target, so they might not be able to generate anything more than a short-lived bounce (if anything at all).
We would like to stress that the above is what we believe as most likely based on today’s prices and it can change in the following days or weeks. Of course we’ll keep you – our subscribers – updated. (…)
Summing up, although crude oil moved higher recently, the long- and medium-term outlooks strongly suggest that lower crude oil prices should be seen in the following weeks and we think that short positions are justified from the risk/reward point of view.
Very short-term outlook: bearish
Short-term outlook: bearish
MT outlook: bearish
LT outlook: mixed with bearish bias
Trading position (short-term; our opinion): Short positions with a stop-loss order at $54.12 (yes, that far as the medium-term outlook is unlikely to change as long as crude oil stays below the declining medium-term resistance line) and initial (!) target price at $35.72 are justified from the risk/reward perspective. We will keep you – our subscribers – informed should anything change.
Thank you.
Nadia Simmons
Forex & Oil Trading Strategist
Przemyslaw Radomski, CFA
Founder, Editor-in-chief
Gold & Silver Trading Alerts
Forex Trading Alerts
Oil Investment Updates
Oil Trading Alerts

