

Trading position (short-term; our opinion): No positions are justified from the risk/reward perspective.
Although crude oil declined at the beginning of the session weakened by the EIA weekly report, the commodity reversed and rebounded quite sharply after the first monthly decline in OPEC supply since February. Thanks to these circumstances, crude oil gained 4.21% and closed the day above $46. Will we see further improvement?
Yesterday, crude oil moved lower and hit a session low of $43.21 after the U.S. Energy Information Administration reported crude oil inventories increased by 4.7 million barrels last week, significantly above expectations for a build of 700,000. Despite this drop, the commodity reversed and rebounded sharply in the following hours supported by news that OPEC supply declined to 31.71 million barrels per day in August (down from a revised level of 31.88 in July), marking its first monthly decline in seven months. Although output from Saudi Arabia remained relatively stable after mild declines in July, Iraqi supply decreased by 40,000 bpd to around 3 million. Thanks to these circumstances, light crude climbed to an intraday high of $46.77. Will we see further improvement in the coming days? (charts courtesy of http://stockcharts.com).
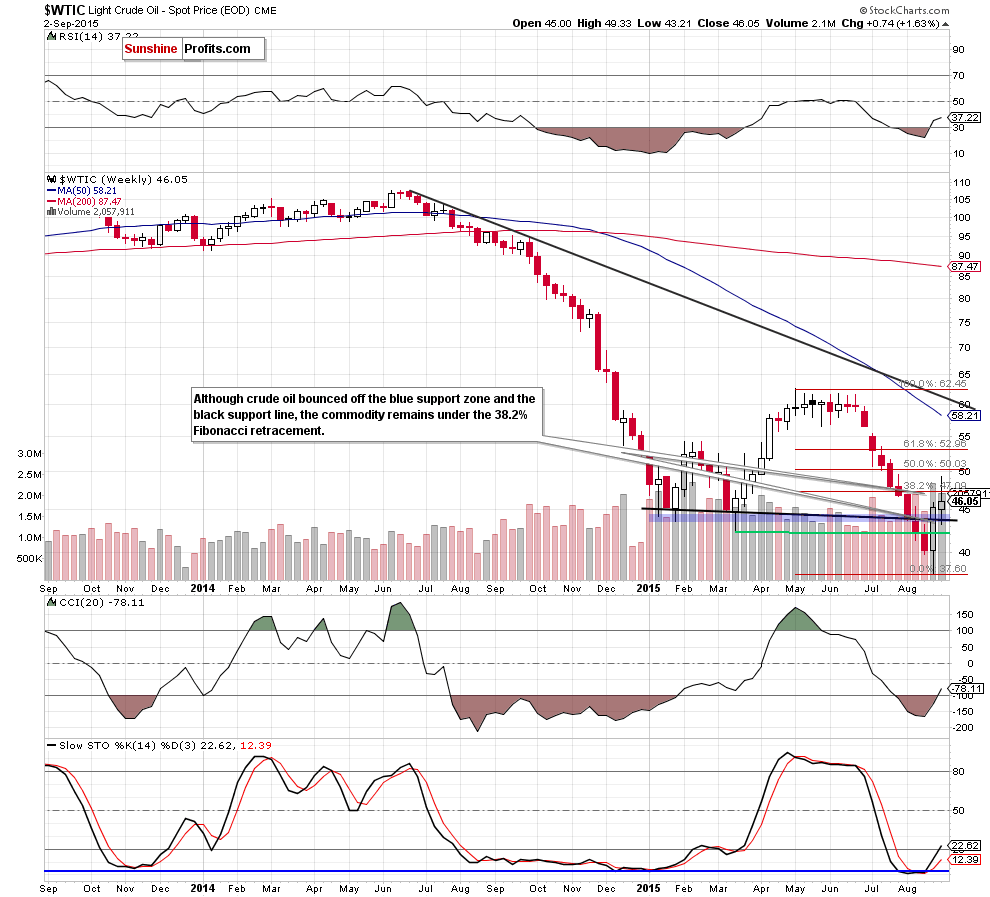
Looking at the weekly chart we see that although crude oil bounced off the blue support zone (based on the Jan lows) and the previously-broken black support line (based on Jan and Mar weekly closing prices), the commodity remains under the 38.2% Fibonacci retracement, which suggests that as long as there is no breakout above this resistance level further rally is questionable.
Will we see further improvement in the coming days? Let’s take a closer look at the daily chart and find out.
In our yesterday’s summary, we wrote the following:
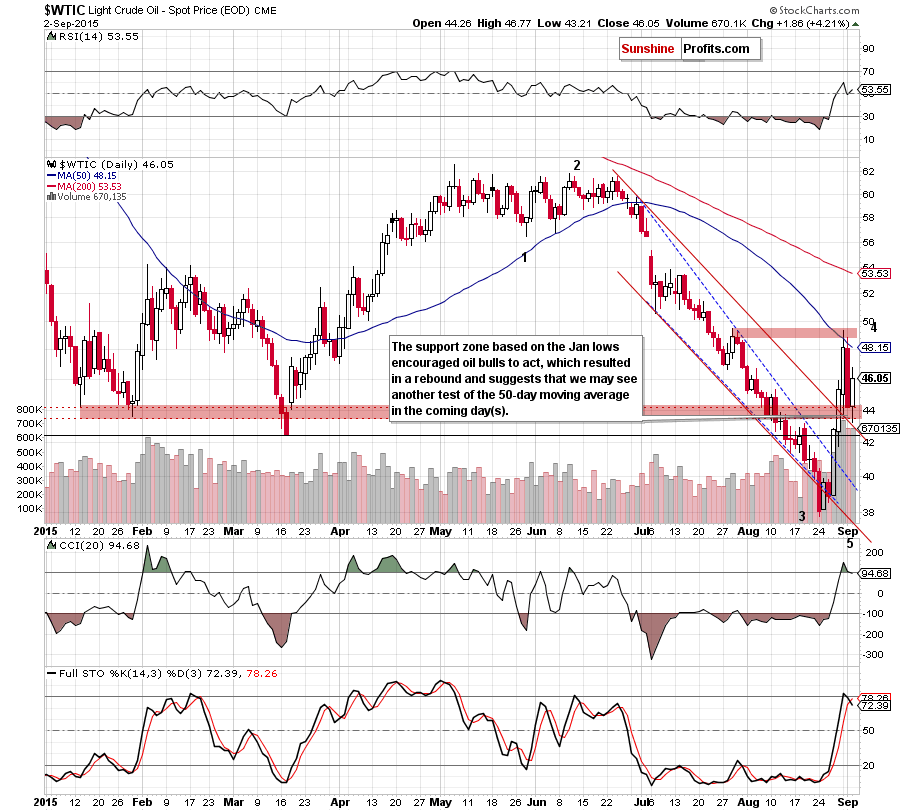
(…) crude oil declined sharply and approached support levels, which could trigger a rebound and another test of the 50-day moving average in the coming day(s).
Looking at the daily chart, we see that oil bulls pushed the commodity higher as we had expected. As you see, the support zone created by the Jan lows (marked with red) in combination with the previously-broken red declining support line (the upper border of the red declining trend channel) triggered a rebound, which took light crude above $46. Taking into account the size of volume that accompanied yesterday’s increase, it seems to us that crude oil will likely move higher once again and re-test the 50-day moving average in the coming day(s).
Nevertheless, we should keep in mind that the current position of the indicators (the CCI and Stochastic Oscillator generated sell signals) suggests that reversal and further deterioration is just around the corner.
Summing up, crude oil bounced off the red support zone on sizable volume, which suggests that we’ll likely see another test of the 50-day moving average in the coming day(s).
Very short-term outlook: mixed with bullish bias
Short-term outlook: bearish
MT outlook: bearish
LT outlook: mixed with bearish bias
Trading position (short-term; our opinion): No positions are justified from the risk/reward perspective. We will keep you – our subscribers – informed should anything change.
Thank you.
Nadia Simmons
Forex & Oil Trading Strategist
Przemyslaw Radomski, CFA
Founder, Editor-in-chief
Gold & Silver Trading Alerts
Forex Trading Alerts
Oil Investment Updates
Oil Trading Alerts

