
Trading position (short-term; our opinion): No positions are justified from the risk/reward perspective.
On Wednesday, crude oil lost 5.18% as worries over a supply glut and slow demand weighed on the price once again. In these circumstances, light crude declined sharply to slightly above $50, invalidting earlier breakouts. Will we see the commodity lower in the coming days?
Yesterday, crude oil moved sharply lower after the market’s open as worries over a supply glut and sluggish demand, ahead of the release of weekly domestic inventories data, weighed on investors’ sentiment. Additionally, traders reacted nervously after a fire and explosion at a gasoline processing unit in a refinery owned by Exxon Mobil in Torrance, California. As a result, light crude accelerated declines and slipped to an intraday low of $50.32. Will we see a drop below $50 in the coming days? (charts courtesy of http://stockcharts.com).
In our previous Oil Trading Alert, we wrote the following:
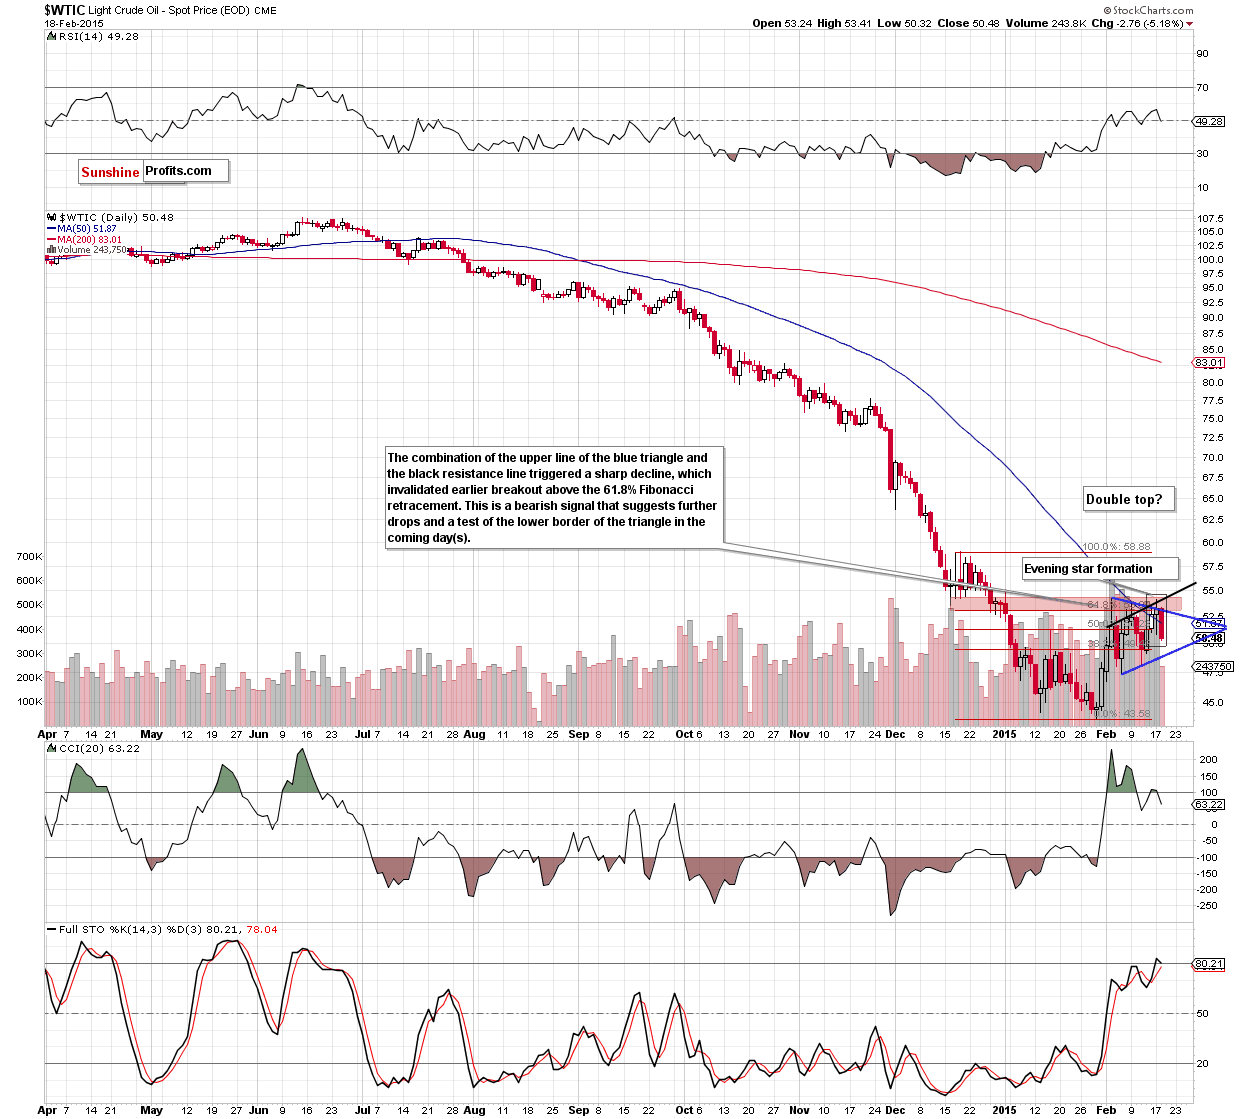
(…) crude oil (…) rebounded, which resulted in an increase above the upper line of the blue triangle. With this upswing, light crude also climbed above the black resistance line (based on daily closing prices), but as it turned out later in the day, this improvement was only temporary (…) crude oil reversed and slipped below the previusly-broken lines, invalidating a breakout, which is a negative signal. On top of that, yesterday’s increase materialized on smaller volume than the previous upswings, which doesn’t confirm the strength of the market and makes the breakout above 61.8% Fibonacci retracement less bullish than it seems at the first sight. Additionally, we should keep in mind that crude oil is still trading under the Dec lows and the Feb high of $54.24, which means that the probability of a double top and reversal is still in play.
Looking at the above chart, we see that oil bears pushed the commodity lower as we expected. With this downswing, crude oil invalidated the breakout above the 61.8% Fibonacci retracement, which triggered a sharp decline to slightly above $50. Additionally, the recent candlesticks formed an evening star pattern, which is a bearish formation that suggests further deterioration. On top of that, the CCI generated a sell signal (and the Stochastic Oscillator is very close to doing the same), which is an additional negative sign. Taking all the above into account, we think that lower values of the commodity are still ahead us. If this is the case, we’ll see a decline to around $48.82, where the lower border of the bue triangle is.
Having said that, let’s examine the weekly chart and find out whether yesterday’s downswing affected the medium-term picture or not.
Yesterday, we wrote:
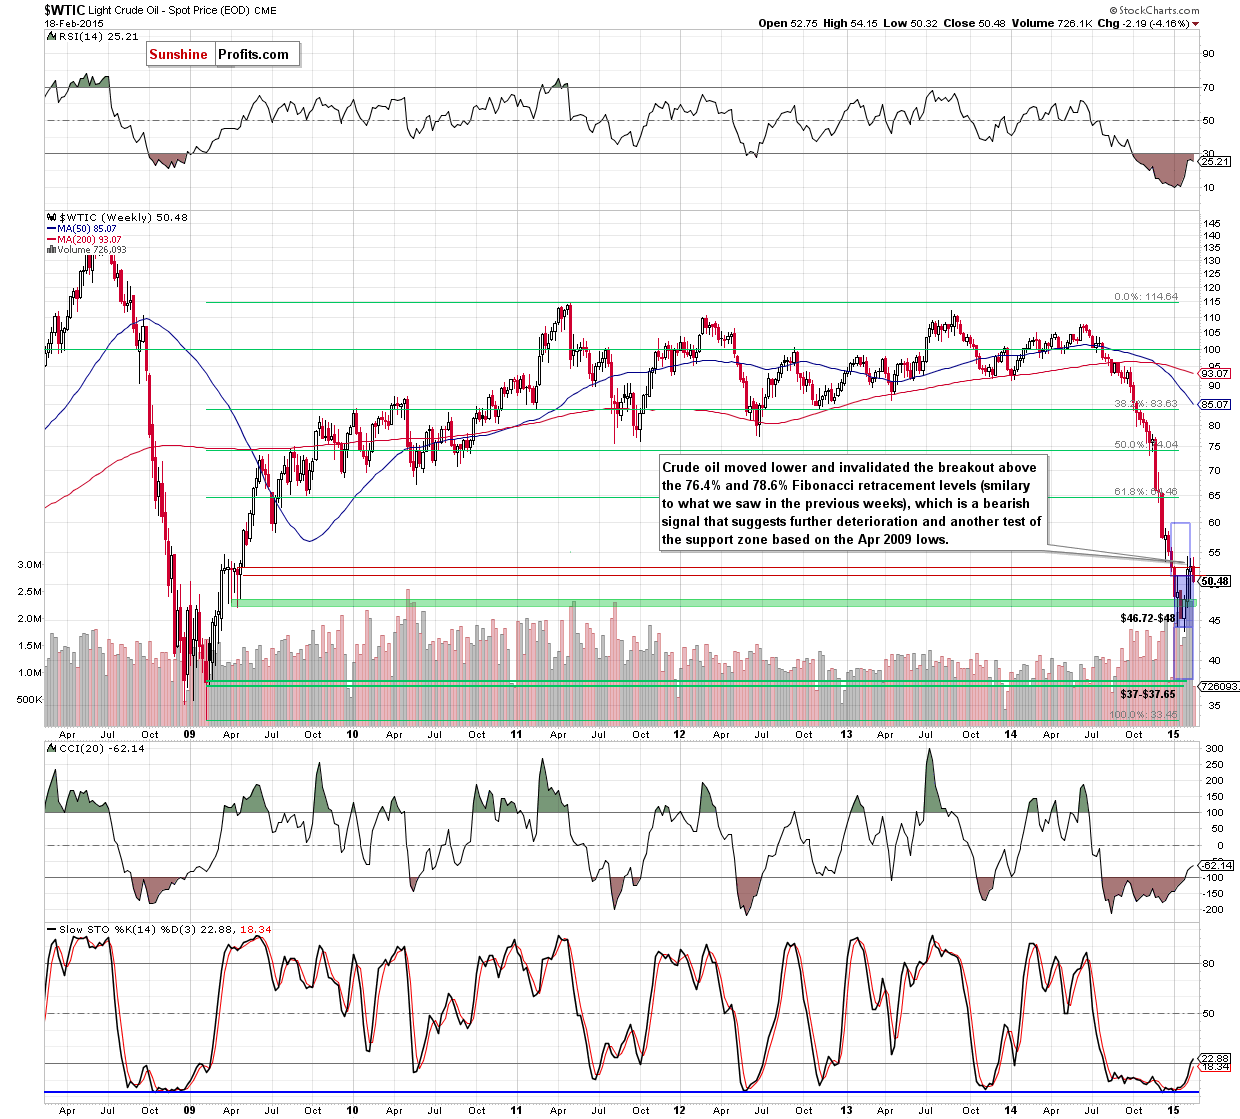
(…) yesterday’s increase resulted in an invalidation of the breakdown under the 76.4% Fibonacci retracement. Although this is a positive sgnal, we saw similar price action in the previous weeks. Back then, despite such improvement, oil bulls didn’t manage to push the commodity higher, which resulted in a pullback to the support zone based on Apr 2009 lows. Taking this fact into account, and combining it with the very short-term picture, we still believe that as long as the commodity is trading below $53.13-$54.24 further improvement is questionable and another pullback (in the coming days) is likely.
As you see on the above chart, history repeated itself once again and oil bulls gave up gained levels. As a result, crude oil reversed and declined sharply, invalidating earlier breakout above the 76.4% and 78.6% Fibonacci retracement levels. Ths is a bearish signal, which suggests further deterioration and another test of the support zone based on the Apr 2009 lows in the coming days.
Before we summarize today’s Oil Trading Alert, we would like to draw your attention to yesterday’s American Petroleum Institute report on crude oil inventories. According to data, domestic crude oil stocks rose by 14.3 million barrels last week, missing analysts’ expectations of an increase of 3.2 million barrels. If today’s U.S. Energy Information Administration data confirms such high increase, it will be the largest weekly growth since EIA data became available in 1982. In this case, oil bears will receive a solid negative factor, which will support the realization of the above-mentioned scenario.
Summing up, crude oil moved sharply lower, invalidating the breakout above the 61.8% Fibonacci retracement (based on the Dec-Jan decline) and the resistance zone created by the 76.4% and 78.6% retracements (marked o the weekly chart). Taking this fact into account, and combining it with the current position of the daily indicators and the bearish API report, we think that further deterioration from here in the coming days is more likely than not. If this is the case, the initial downside target would be around $48.82.
Very short-term outlook: mixed with bearish bias
Short-term outlook: mixed
MT outlook: mixed
LT outlook: bullish
Trading position (short-term; our opinion): No positions are justified from the risk/reward perspective. Nevertheless, if we see a daily close above the upper line of the blue triangle and the black resistance line, we’ll consider opening long positions. We will keep you informed should anything change.
Thank you.
Nadia Simmons
Forex & Oil Trading Strategist
Przemyslaw Radomski, CFA
Founder, Editor-in-chief
Gold & Silver Trading Alerts
Forex Trading Alerts
Oil Investment Updates
Oil Trading Alerts

