

Trading position (short-term; our opinion): Short positions with a stop-loss order at $54.12 and initial (!) target price at $35.72 are justified from the risk/reward perspective.
On Wednesday, crude oil lost 3.54% as a stronger greenback and worries over another build in domestic oil inventories continued to weigh on the price. In this environment, light crude slipped under $45 and reached its key support zone. Will it manage to encourage oil bulls to act in the coming days?
Yesterday, the U.S. Labor Department showed in its Job Openings and Labor Turnover Survey that nationwide openings increased to a new high in July, climbing to the level of 5.8 million. Thanks to these bullish numbers, the USD Index moved higher, making crude oil less attractive for buyers holding other currencies. In this environment, light crude moved sharply lower and reached its key support zone. Will we see another rebound from here? (charts courtesy of http://stockcharts.com).
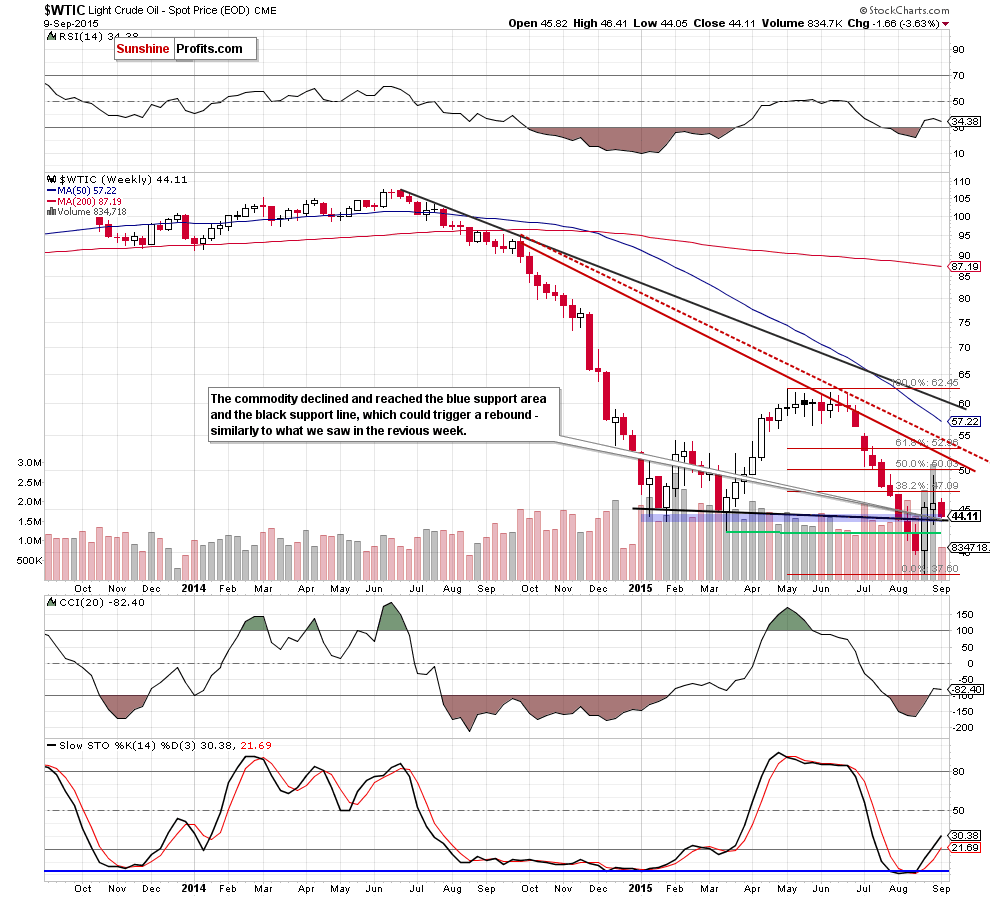
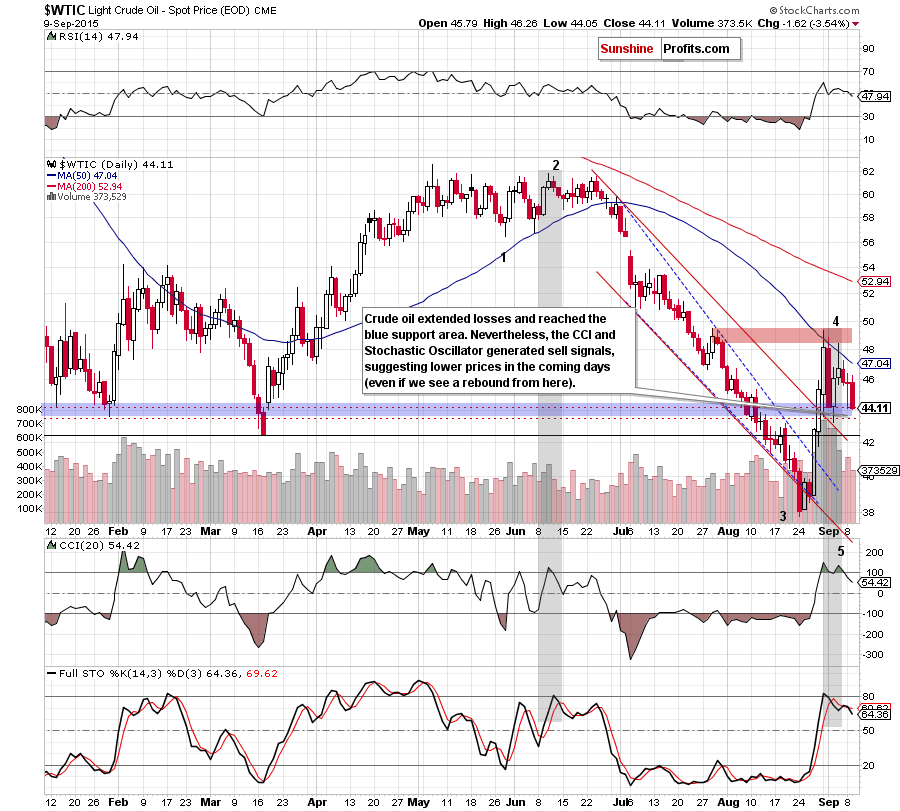
Looking at the above charts we see that crude oil extended losses and reached the blue support zone (based on the Jan lows) and the previously-broken black support line (based on Jan and Mar weekly closing prices), which could trigger a rebound from here – similarly to what we saw in the previous week. Nevertheless, even if we see such price action, it seems that the 50-day moving average in combination with the declining resistance line and the 38.2% Fibonacci retracement level will be strong enough to stop further improvement. Additionally, it is worth noting that the daily CCI and Stochastic Oscillator generated sell signals, supporting oil bears and suggesting lower prices in the coming days (even f we see a short-lived rebound).
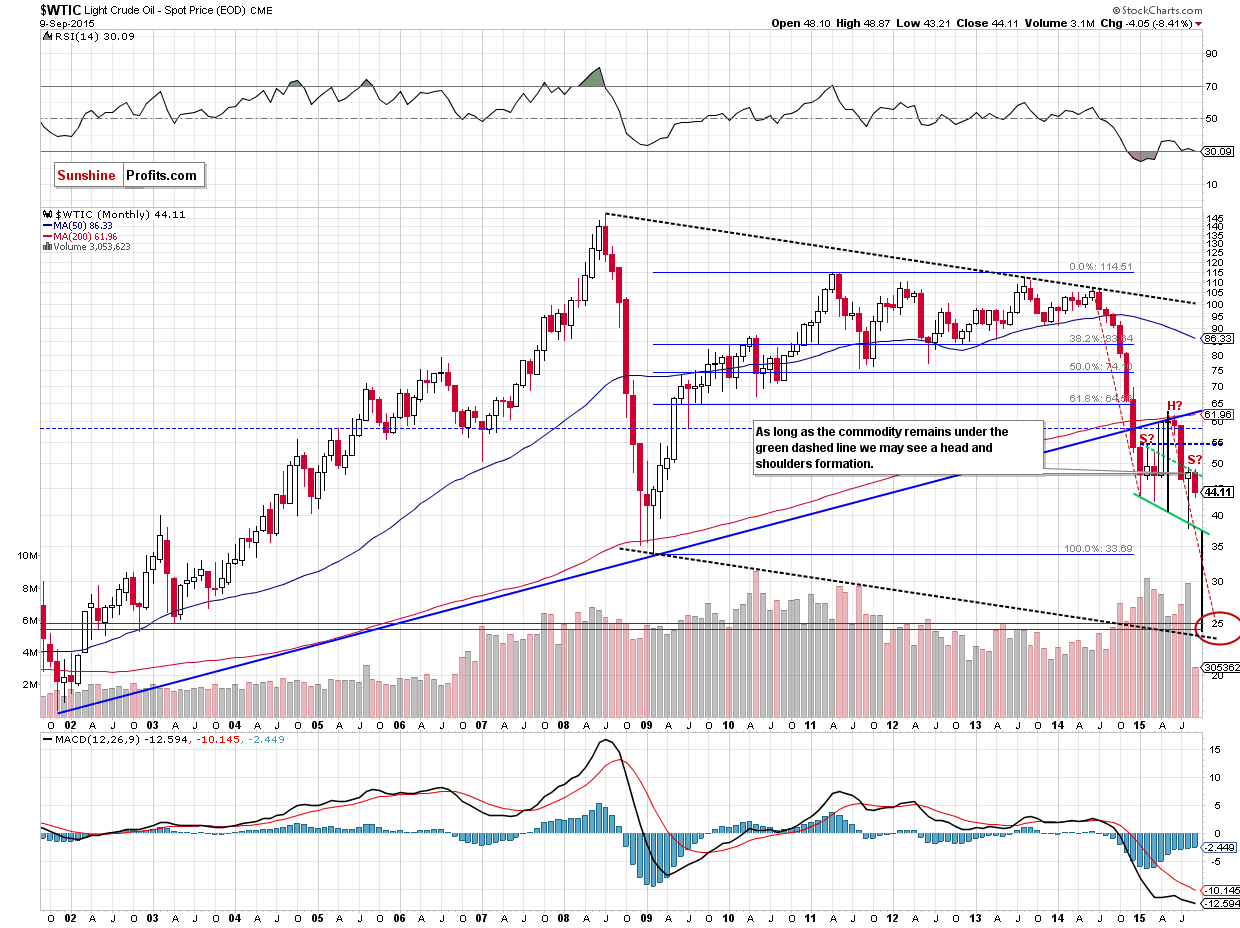
On top of that, the long-term picture clearly shows that the crude oil’s rally that we saw earlier was just a verification of the breakdown below the rising long-term support line (in this case, there was no invalidation).
Taking all the above into account, we believe that everything what we wrote on crude oil’s outlook in yesterday’s alert remains up-to-date:
(...) it seems quite likely that crude oil will slide all the way down to more or less $25 dollars and there are multiple reasons for it:
- The breakdown below the key long-term rising support line (marked with blue) was confirmed and verified – this year’s rally didn’t take crude oil back above it – the line proved to be strong resistance. This by itself doesn’t imply a target level at a certain point, but it strongly suggests that crude oil has to fall much lower, before the decline is over.
- The symmetry of major declines: the 2008 slide is the only decline that is really similar to the current one, and in order for this similarity to be upheld (history repeats itself to a considerable extent), crude oil would have to move even a bit below $25. On the above chart you can see that in the form of the declining dashed black lines.
- The symmetry between the 2014 slide and the (likely) current decline. This year we have definitely seen some kind of consolidation (which might still turn out to be a bottom, but that is unlikely in our view) and the move that follows a consolidation is very often similar to the one that preceded it. If you look at the red dashed declining lines on the above chart you’ll notice that for the previous decline to repeat, crude oil would have to move to about $25.
- Speaking of the consolidation, it’s taking the form of a head-and-shoulders pattern and once / if the pattern is completed, we will have a pattern-based target at around $25. The reason is that once price breaks below the “neck level”, it’s likely to decline as much as the size of the “head” in the pattern.
- The late-2002 and 2003 bottoms create strong support at those levels.
The amount of signals that points to $25 as the most likely target is uncanny, which makes it quite reliable.
Yes, there also are the 2008 and 2009 lows, but generally not much (if anything) confirms them as a major target, so they might not be able to generate anything more than a short-lived bounce (if anything at all).
We would like to stress that the above is what we believe as most likely based on today’s prices and it can change in the following days or weeks. Of course we’ll keep you – our subscribers – updated.
Summing up, the medium-term outlook for the black gold remains bearish, and yesterday’s decline seems to confirm it. Although the commodity could rebound slightly from the current levels (as the blue support zone may encourage oil bulls to act), an invalidation of the previous breakout above the 50-day moving average and the 38.2% Fibonacci retracement is a major bearish event and crude oil’s recent weakness seems to confirm it. Therefore, we think that short positions (which are already profitable as we entered them when crude oil was at about $46.68) continue to be justified from the risk/reward point of view.
Very short-term outlook: bearish
Short-term outlook: bearish
MT outlook: bearish
LT outlook: mixed with bearish bias
Trading position (short-term; our opinion): Short positions with a stop-loss order at $54.12 (yes, that far as the medium-term outlook is unlikely to change as long as crude oil stays below the declining medium-term resistance line) and initial (!) target price at $35.72 are justified from the risk/reward perspective. We will keep you – our subscribers – informed should anything change.
Thank you.
Nadia Simmons
Forex & Oil Trading Strategist
Przemyslaw Radomski, CFA
Founder, Editor-in-chief
Gold & Silver Trading Alerts
Forex Trading Alerts
Oil Investment Updates
Oil Trading Alerts

