
Trading position (short-term; our opinion): In our opinion no positions are justified from the risk/reward perspective.
On Wednesday, crude oil lost 1.12% as bearish the EIA weekly report and a stronger U.S. dollar pushed the commodity lower. Because of these circumstances, light crude hit a fresh multi-month low, slipping below the Jan low. Are there any technical factors that could support oil bulls in the nearest future?
Yesterday, the U.S. Energy Information Administration showed in its weekly report that U.S. crude oil inventories declined by 1.0 million barrels in the week ended September 5, missing expectations for a decline of 1.2 million barrels. Additionally, gasoline inventories increased by 2.4 million barrels, compared to forecasts for a decline of 0.2 million barrels, while distillate stockpiles rose by 4.1 million barrels. These disappointing numbers showed weaker demand for crude oil and petroleum products than expected, which was bearish for the price. On top of that, a stronger greenback helped push the commodity lower as well, making light crude less attractive on dollar-denominated exchanges, especially among investors holding other currencies. In this environment, crude oil dropped to its lowest level since May 2013, hitting an intraday low of $91.22. How much more room to declines does light crude have? Let’s examine charts and look for clues (charts courtesy of http://stockcharts.com).
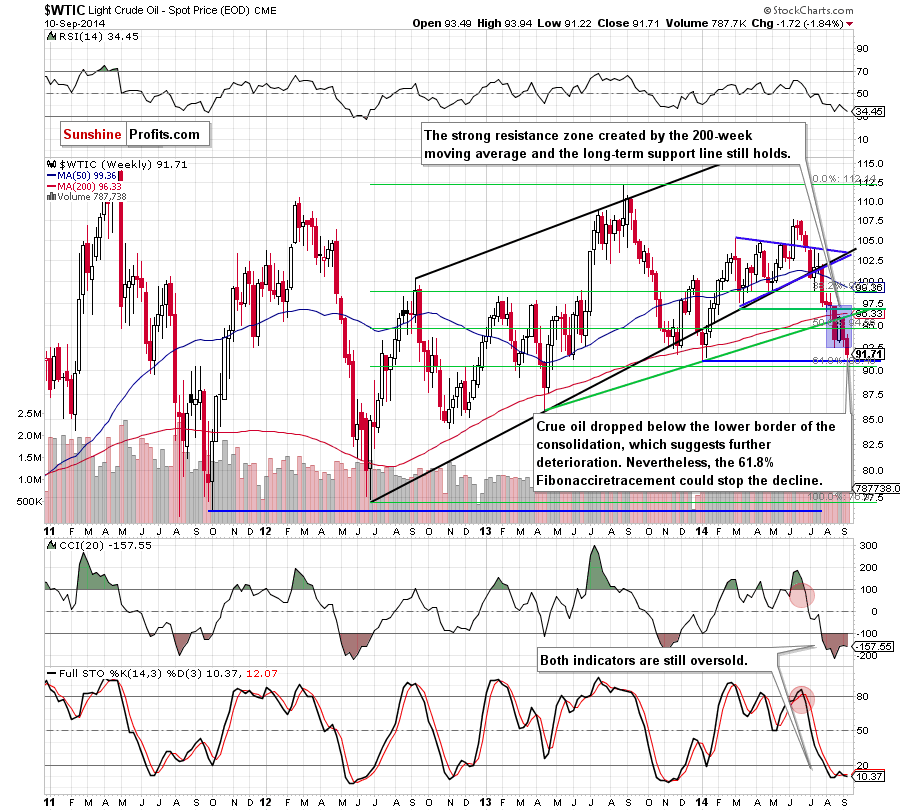
The situation in the medium term has deteriorated as crude oil dropped below the lower border of the consolidation and slipped under the Jan low, which suggests further deterioration. Nevertheless, we should keep in mind that despite this drop, the 61.8% Fibonacci retracement still holds, which may encourage oil bulls to act. Are there any other technical factors that could be supportive for the commodity? Let’s take a look at the same chart from a broader perspective.
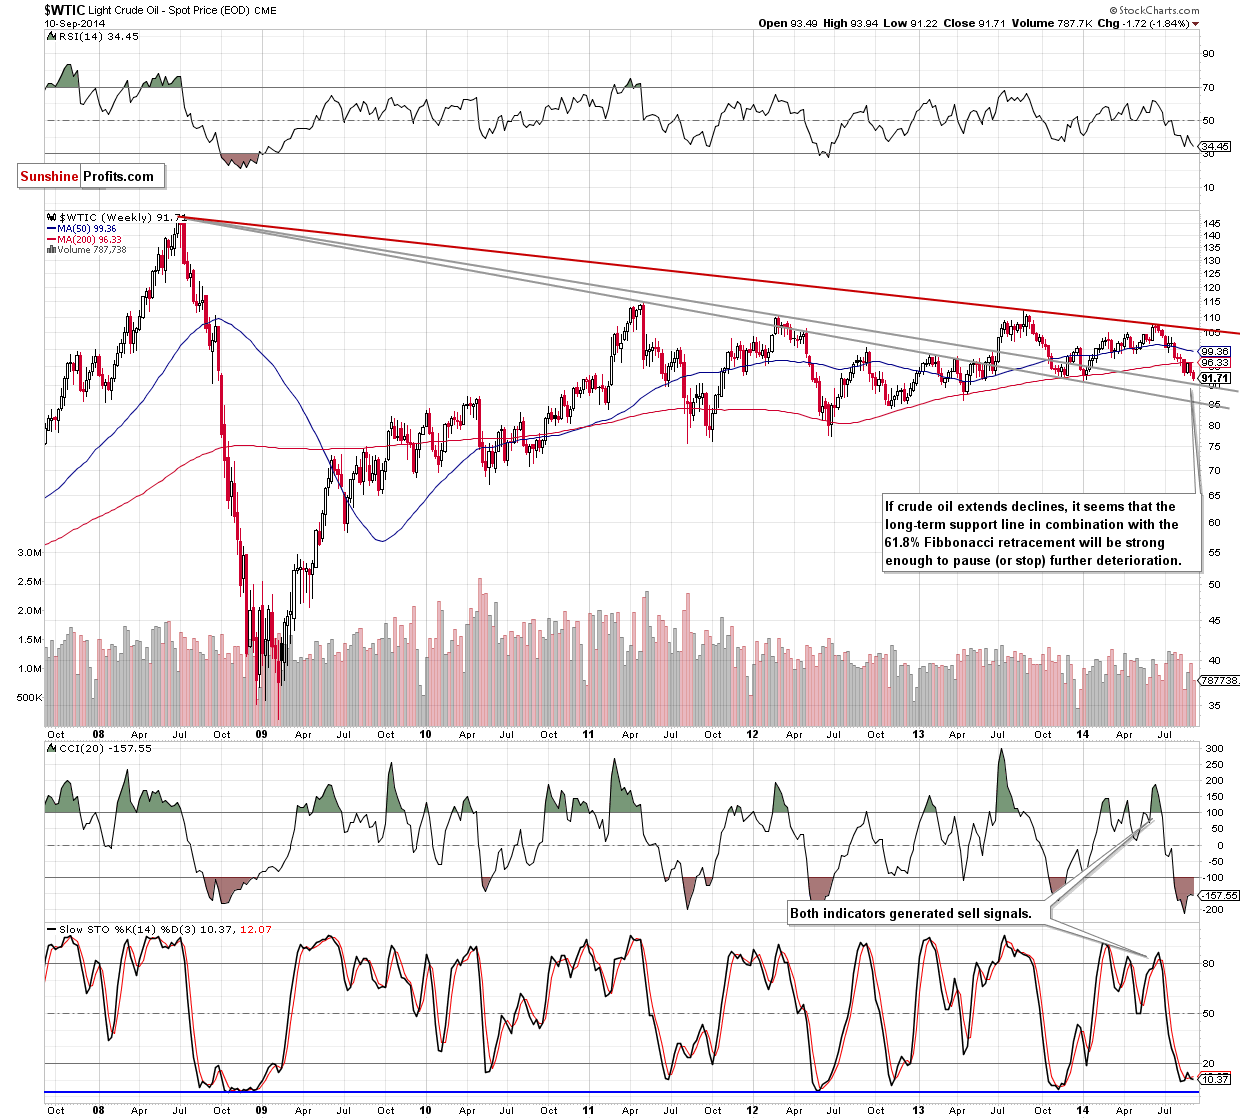
Looking at the above chart, we see that crude oil is trading quite close to the long-term declining support line (marked with grey). What’s interesting, in this area (around $90) is also the above-mentioned 61.8% Fibonacci retracement, which together create a solid support zone that could pause (or even stop) further deterioration. Taking into account the importance of this area, it seems to us that oil bulls do not give up so easily and will fight for it in the coming week. If they win, crude oil will rebound to at least the strong resistance zone created by the previously-broken 200-day moving average and the long-term support/resistance green line seen on the first chart. What could happen if they fail? Without a doubt it would be a very strong bearish signal, which could result in a drop even to around $86, where the lower long-term grey support line is. At this point, it’s worth noting that this area is also reinforced by the support level based on the Apr 2013 low.
Will the daily chart give us more clues about future move? Let’s check.
In our Oil Trading Alert posted on Sep 3, we wrote the following:
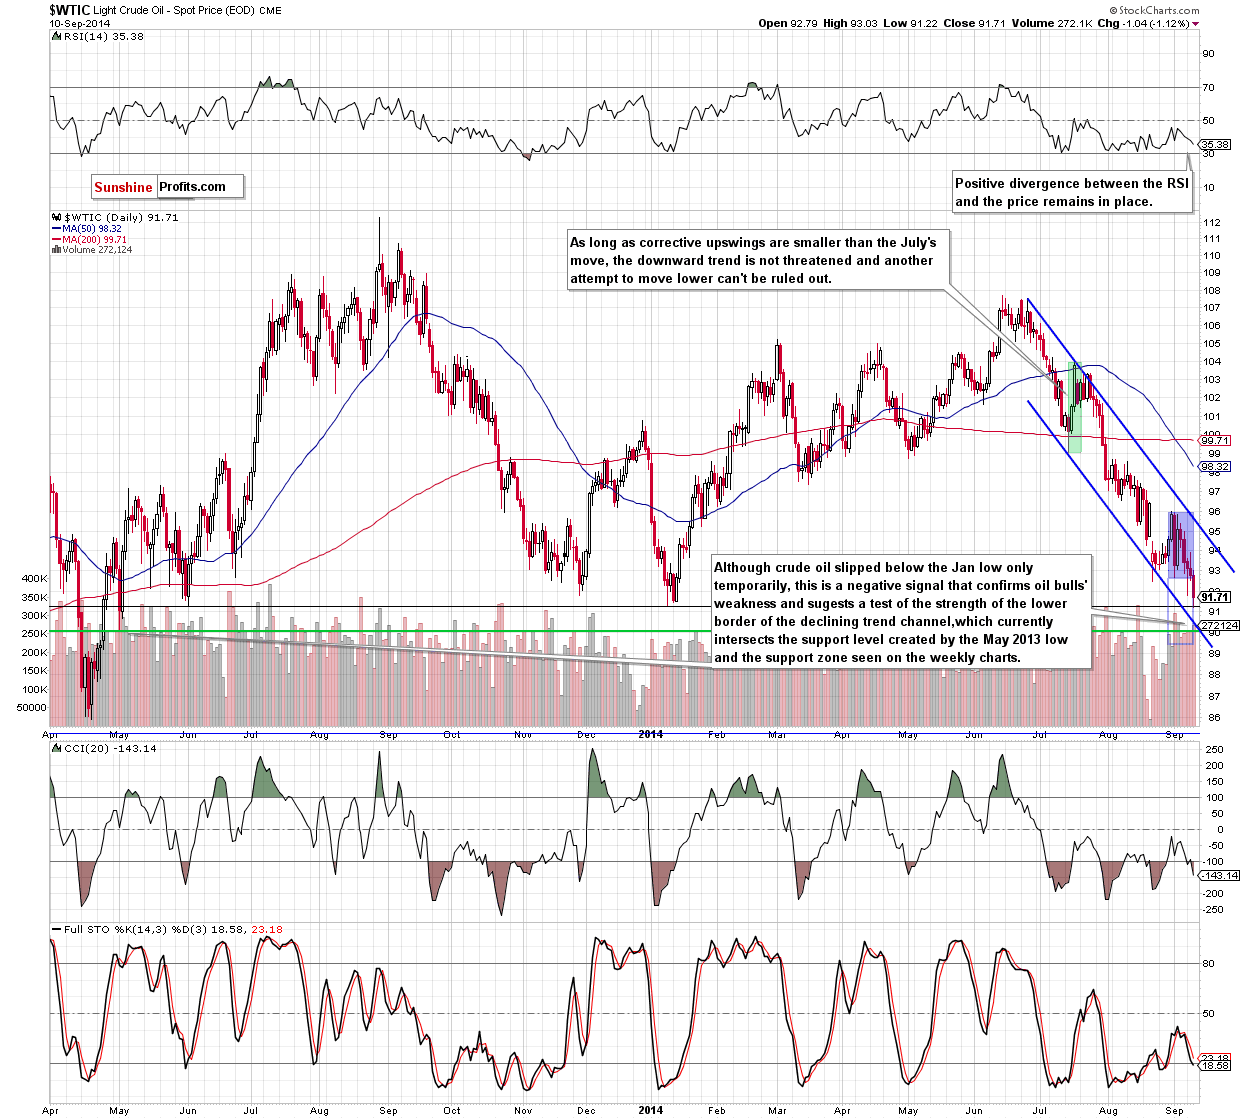
(…) when we take a closer look at the daily chart, we clearly see that the recent corrective upswing is much smaller than the previous one, which means that oil bulls are even weaker than they were in July. Therefore, in our opinion, the downward trend is not threatened at the moment and another attempt to move lower should not surprise us. If this is the case, we think that the next downside target will be the combination of the 2014 low and the lower border of the declining trend channel around $91.24-$91.50.
On the daily chart, we see that the situation developed in line with the above-mentioned scenario and crude oil not only reached the Jan low, but also slipped slightly below it, hitting a multi-month low of $91.22. Although yesterday’s drop is barely visible from the daily perspective, it shows that oil bulls are quite weak, which may result in a drop to the lower border of the declining trend channel (currently around $90). As you see on the above chart, this area is also reinforced by the support level based on the May 2013 low (and the support zone that we discussed earlier). Taking this fact into account, we think that even if crude oil moves lower, the space for further declines is limited. At this point it’s worth noting that there is also a positive divergence between the RSI and the price. What does it mean for crude oil? When we take a closer look at the above chart, we see that there was a similar situation in November. Back then, such circumstances preceded a sharp increase in the following days. Therefore, all the above provides us with bullish implication and suggests that corrective upswing is just around the corner.
Summing up, although crude slipped below the Jan low, hitting a fresh multi-month low, the commodity still remains above the very strong support zone created by the long-term declining support line, the 61.8% Fibonacci retracement level (based on the Jun 2012-Aug 2013 rally), the lower border of the declining trend channel and the May 2013 low. Taking into account the importance of this area, it seems to us that the commodity will rebound from here in the coming days. Nevertheless, we think that staying on the sidelines and waiting for a confirmation/invalidation of the above before opening long positions is the best choice at the moment.
Very short-term outlook: mixed with bullish bias
Short-term outlook: mixed
MT outlook: bearish
LT outlook: bullish
Trading position (short-term): No positions are justified from the risk/reward perspective at the moment, but we will keep you informed should anything change.
Thank you.
Nadia Simmons
Forex & Oil Trading Strategist
Przemyslaw Radomski, CFA
Founder, Editor-in-chief
Gold & Silver Trading Alerts
Forex Trading Alerts
Oil Investment Updates
Oil Trading Alerts

