

Trading position (short-term; our opinion): No positions are justified from the risk/reward perspective.
On Thursday, the black gold declined once again as the combination of an increase in crude oil stocks at the Cushing, Oklahoma and a broadly stronger U.S. dollar continued to weigh on the price. Thanks to these circumstances, light crude lost 0.27% and slipped temporary under the barrier of $50. What’s next for the commodity?
Let’s take a look at the charts below to find out (charts courtesy of http://stockcharts.com).
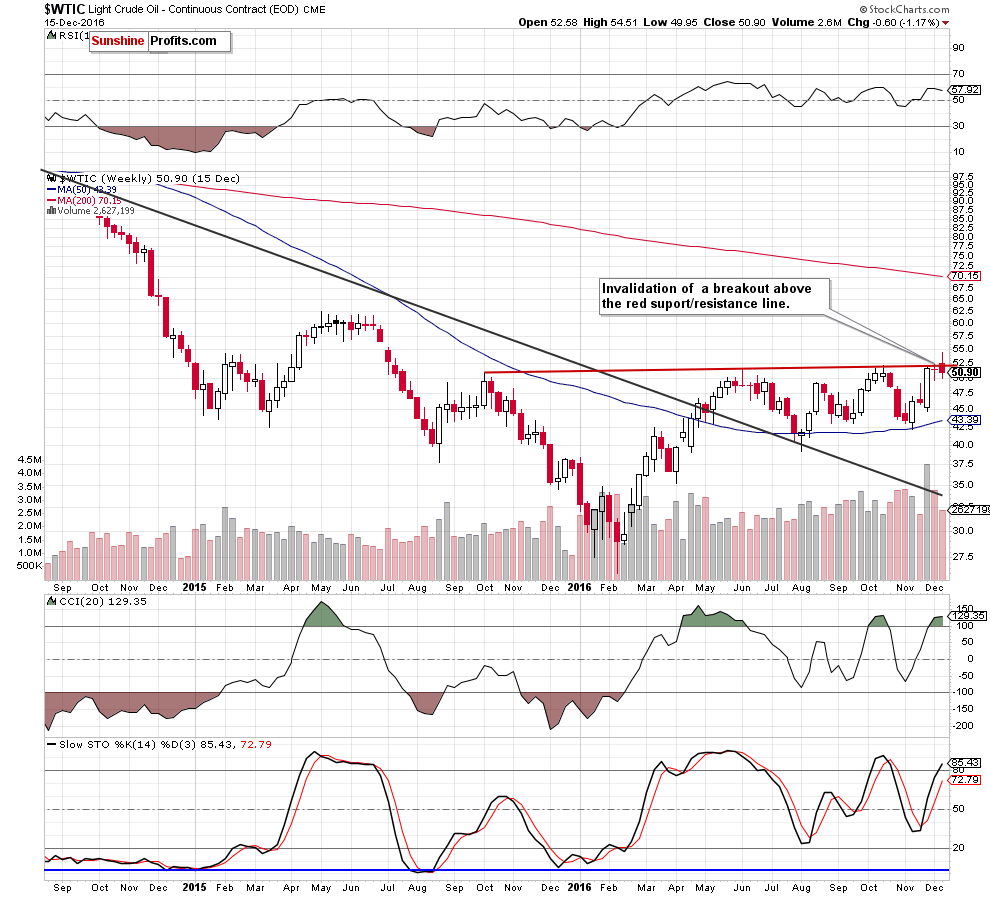
The first thing that catches the eye on the weekly chart is invalidation of a breakout above the long-term red resistance line, which is a negative signal that suggests further deterioration in the coming week. Nevertheless, it would be more bearish and reliable if the commodity closes this week under this important resistance.
Will we see such price action? Let’s examine the daily chart and look for more clues about future moves.
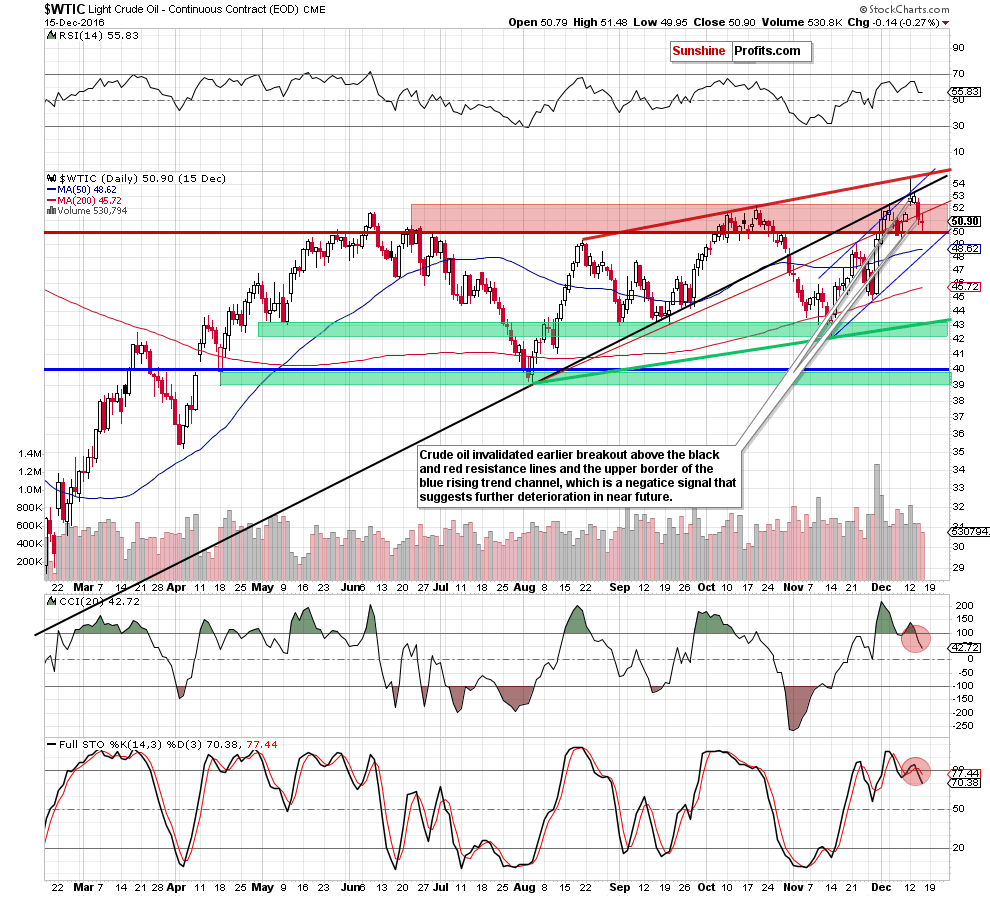
From this perspective, we see that light crude increased to the red line based on the Aug 19 and Oct 10 highs at the beginning of the week. Despite the improvement, this resistance stopped oil bulls (similarly to what we saw in Oct), which resulted in a correction of earlier upward move. Thanks to this week’s decline, crude oil invalidated the breakout above the medium-term black resistance line, the red resistance line and the upper border of the blue rising trend channel, which is a negative development.
With yesterday’s drop, the commodity slipped under the barrier of $50, but this move was only temporary and light crude closed the day above this important level. In this way, light crude invalidated this tiny breakdown, which resulted in a rebound earlier today. Taking this fact into account, it seems that the commodity could climb to the previously-broken red resistance line or even to the medium-term black resistance line (currently around $53.89) and verified the breakdown in the following days.
Nevertheless, we should keep in mind that the CCI and Stochastic Oscillator generated sell signals, suggesting another attempt to move lower – most likely at the beginning of the coming week.
Summing up, the outlook for the commodity is more bearish than bullish as the black gold remains below the key resistance lines. Nevertheless, yesterday’s price action took the commodity to the barrier of $50 (additionally we saw an invalidation of a small breakdown), which increases the probability of another upward move and verification of the breakdown under the red or even the black resistance line in the coming day(s).
Very short-term outlook: mixed with bearish bias
Short-term outlook: mixed
MT outlook: mixed
LT outlook: mixed
Trading position (short-term; our opinion): No positions are justified from the risk/reward perspective. We will keep you – our subscribers – informed should anything change.
Thank you.
Nadia Simmons
Forex & Oil Trading Strategist
Przemyslaw Radomski, CFA
Founder, Editor-in-chief, Gold & Silver Fund Manager
Gold & Silver Trading Alerts
Forex Trading Alerts
Oil Investment Updates
Oil Trading Alerts

