
Trading position (short-term; our opinion): In our opinion no positions are justified from the risk/reward perspective.
On Wednesday, crude oil gained 1.33% as the combination of upbeat Chinese growth numbers and bullish the EIA weekly report supported the price. Thanks to these circumstances, the commodity bounced off a two-month low and invalidated earlier breakdown below two important support/resistance lines. Does it mean that a new uptrend has begun?
Yesterday, official data showed that China’s economy expanded at an annual rate of 7.5% in the second quarter, beating expectations for growth of 7.4%. Additionally, a separate report showed that industrial production in China rose by an annualized rate of 9.2% in June, compared to expectations for a 9% increase.
On top of that, crude oil extended gains and hit the highest levels of the session after the U.S. Energy Information Administration showed in its weekly report that U.S. crude oil inventories declined by 7.5 million barrels in the week ended July 11, beating expectations for a decline of 2.1 million barrels.
As we mentioned earlier, thanks to these bullish figures, the price of crude oil invalidated earlier breakdown below two important support/resistance lines. Are there any other encouraging technical signals that could push the price higher in the nearest future? Let’s find out (charts courtesy of http://stockcharts.com).
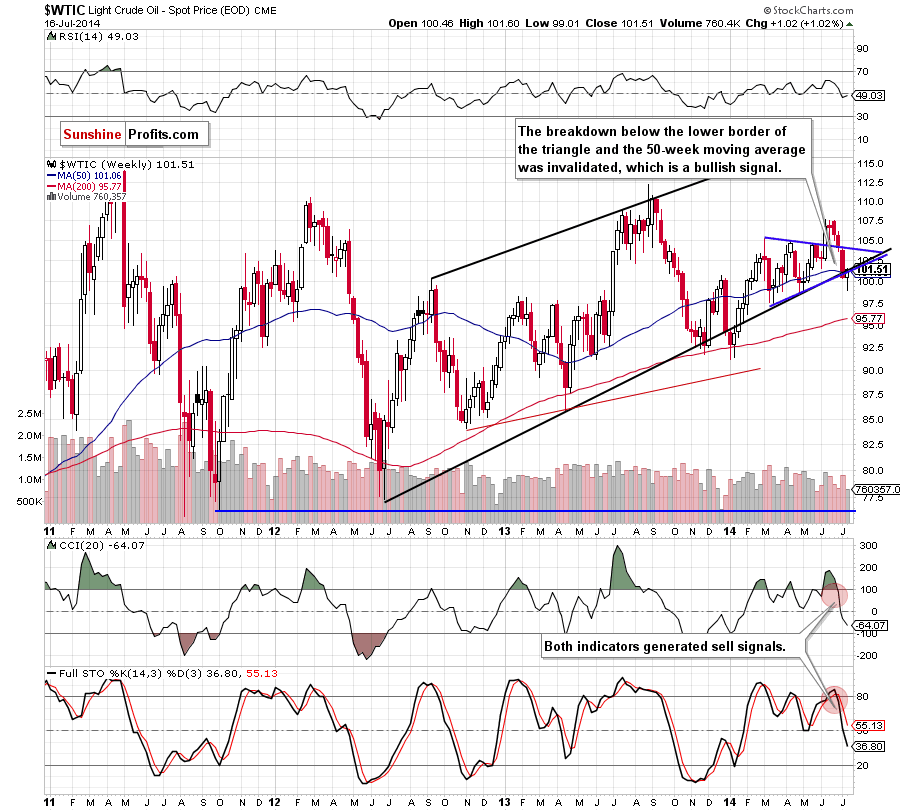
From the medium-term perspective, we see that crude oil reversed and invalidated the breakdown below the lower border of the blue triangle. With this upswing, the commodity also climbed above the previously-broken 50-week moving average and reached the June low of $101.60, which is the last resistance level before further improvement. Therefore, if it holds, we’ll likely see a pullback to around $101, where the nearest support line is. However, if it is broken, crude oil will extend the rally. How high could light crude go? Let’s look for answer on the daily chart.
Quoting our previous Oil Trading Alert:
(…) In our opinion, the very short-term outlook will improve only if we see an upward move similar (or bigger) to the one that we saw between June 19 and June 25. Will we see a move higher in the coming days? Considering the shape of yesterday's candlestick, and the place where it appeared, it’s quite likely. (…) it has a long lower shadow, which clearly indicates the importance of this area for oil bulls and suggests that their opponents should have a tough time breaking through it. At this point, it’s worth noting that a similar situation from the beginning of September resulted in a bigger corrective upward move. Taking this fact into account and combining it with the current position of the indicators (…), it seems to us that a pause or correction in short term is just around the corner.
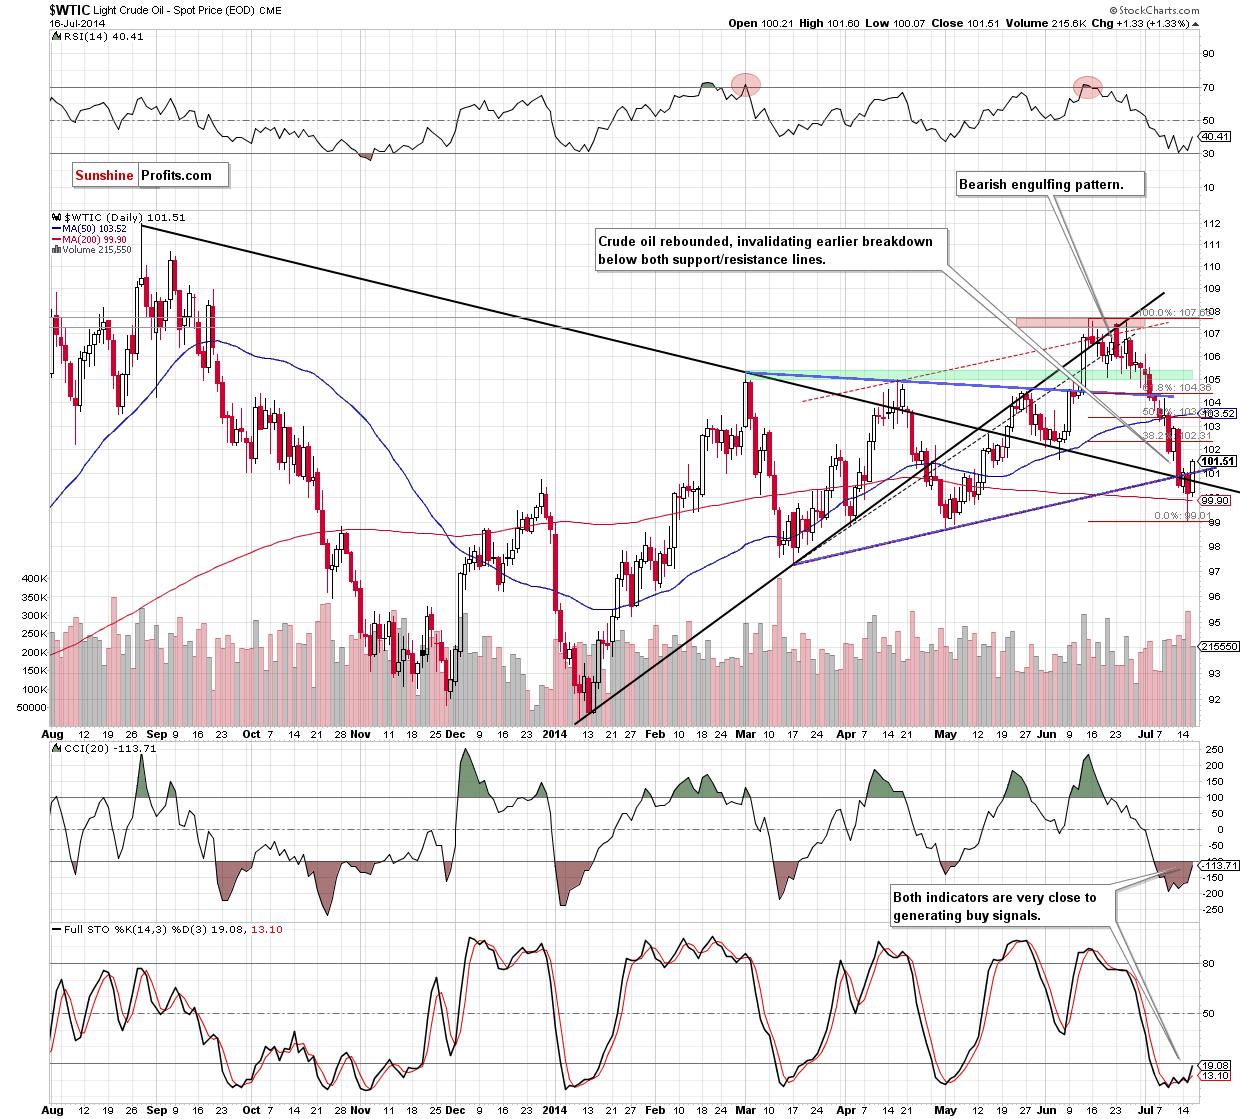
The chart above clearly illustrates that the situation developed in line with our yesterday’s commentary as crude oil moved visibly higher, invalidating the breakdown below the long- and medium-term support/resistance lines. As you know from our previous Oil Trading Alerts, an invalidation of the breakdown is a strong bullish signal, which usually triggers further improvement. Will we see such price action in the nearest future? The good news for oil bulls is that the yesterday’s upside move is bigger than the one that we saw between June 19 and June 25, which means that the very short-term outlook has improved. Additionally, the CCI and Stochastic Oscillator are very close to generating buy signals. So, what’s next for crude oil? Taking all the above into account, we remain convinced that what we wrote in our yesterday’s summary is up-to-date:
(…) if crude oil climbs above both resistance lines, we’ll see a corrective upswing to at least $102.30, where the 38.2% Fibonacci retracement (based on the entire recent decline) is.
Summing up, the main development of yesterday’s session in an invalidation of the breakdown below the long- and medium-term support/resistance lines. Technically, the commodity is currently correcting its losses, which is not surprising as it just tested a psychologically important level of $100. No one can predict for sure what will happen in the next few weeks (taking into account the variety of fundamental factors – including situation in Libya and Iraq), but based on our experience we believe that crude oil will increase to at least $102.30, where the 38.2% Fibonacci retracement (based on the entire recent decline) is.
Very short-term outlook: bullish
Short-term outlook: mixed
MT outlook: mixed
LT outlook: mixed
Trading position (short-term):
Thank you.
Nadia Simmons
Forex & Oil Trading Strategist
Przemyslaw Radomski, CFA
Founder, Editor-in-chief
Gold & Silver Trading Alerts
Forex Trading Alerts
Oil Investment Updates
Oil Trading Alerts

