

Trading position (short-term; our opinion): No positions are justified from the risk/reward perspective.
On Friday, crude oil moved sharply lower after the market’s open and reached an important support level, which encouraged oil bulls to act in the following hours. How did this action affect the technical picture of the black gold?
Let’s take a closer look at the charts below and find out (charts courtesy of http://stockcharts.com).

Looking at the weekly chart, we see that crude oil broke below the green dashed line based on the August and November lows, which triggered an acceleration of declines. As a result, light crude slipped slightly below the 38.2% Fibonacci retracement based on the entire February-January upward move, but then reversed and rebound.
How did this price action affect the very short-term picture of the commodity? Let’s examine the daily chart and find out.
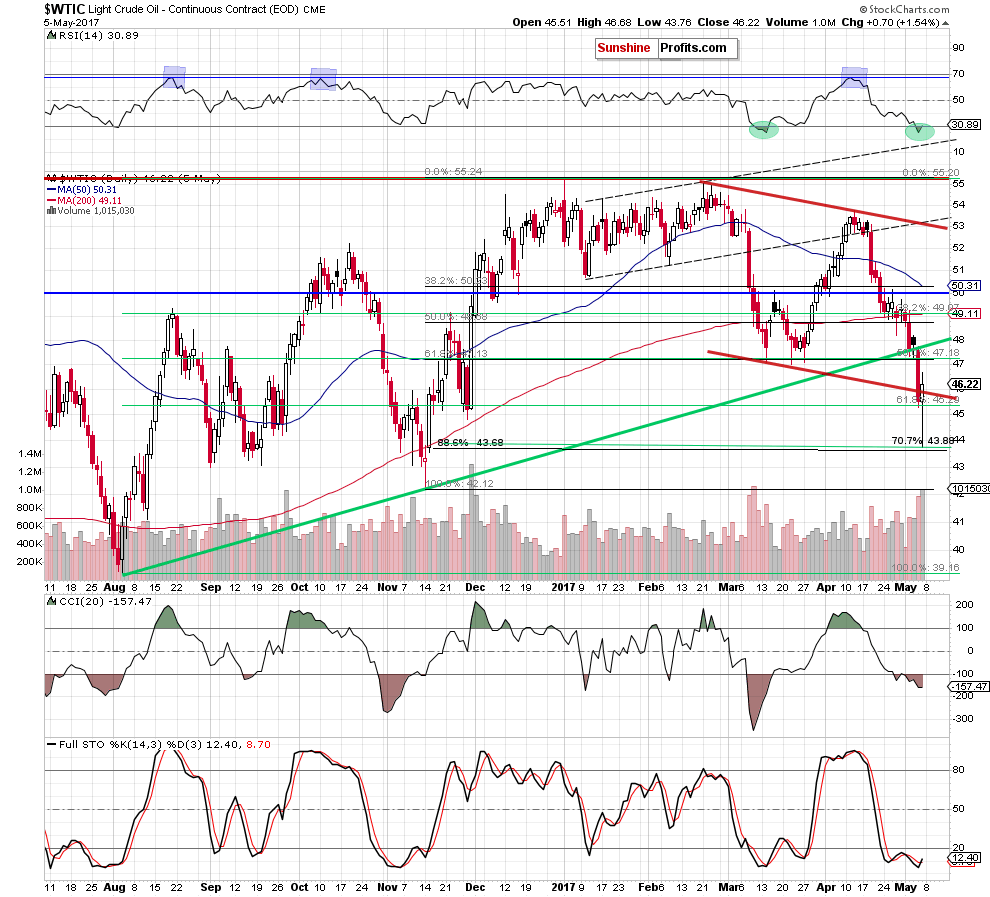
From this perspective, we see that the breakdown under the green support line and the previous lows pushed the black gold not only below the 61.8% Fibonacci retracement, but also under the lower border of the red declining trend channel. Thanks to this drop, light crude slipped to the support zone created by the 70.7% retracement based on the August-January upward move and the 88.6% retracement based on the November-January increases (and reinforced y the 38.2% retracement seen on the weekly chart), which encouraged oil bulls to act.
As a result, crude oil rebounded sharply and came back above the 61.8% Fibonacci retracement and the lower border of the red declining trend channel, invalidating the earlier breakdowns. Additionally, Friday’s move materialized on significant volume, which increases the probability of further improvement in the coming week. This scenario is also reinforced by the buy signals generated by the Stochastic Oscillator and the RSI. At this point, it is worth noting that we saw the RSI at similar levels in mid-March, which translated into a bigger upward move in the following weeks. Therefore, it seems to us that further improvement is just around the corner.
If this is the case, the initial upside target will be around $47.86, where the previously-broken long-term green line (based on the August and November lows) currently is.
Summing up, although crude oil extended losses on Friday, the combination of the Fibonacci retracements stopped further deterioration and triggered a rebound, which invalidated the earlier breakdown under the 61.8% Fibonacci retracement and the lower border of the red declining trend channel. This is a bullish development, which suggests further improvement in the coming week.
Very short-term outlook: mixed with bullish bias
Short-term outlook: mixed
MT outlook: mixed
LT outlook: mixed
Trading position (short-term; our opinion): No positions are justified from the risk/reward perspective. Nevertheless, if we see another daily closure above the lower border of the red declining trend channel, we’ll consider opening long positions. We will keep you – our subscribers – informed should anything change.
Thank you.
Nadia Simmons
Forex & Oil Trading Strategist
Przemyslaw Radomski, CFA
Founder, Editor-in-chief, Gold & Silver Fund Manager
Gold & Silver Trading Alerts
Forex Trading Alerts
Oil Investment Updates
Oil Trading Alerts

