

Trading position (short-term; our opinion): Long positions (stop loss at $42.88; next upside target at $49.70) are justified from the risk/reward perspective.
Crude oil has been declining slowly, but there are some sings pointing to an increase in the volatility in the coming days. Which way is the black gold likely to move?
In short, it seems that we are in the “pennies to the downside, dollars to the upside” situation and the risk to reward is now favoring a long position. Let’s take a look at the chart for details (charts courtesy of http://stockcharts.com).
There were barely any changes on the crude oil chart since last Wednesday. Back then, we wrote the following:
(…) Crude oil moved below $47 level (…), which is the upper part of our support area, so the question is if the decline is already over. It could be, but in our view, it’s really too early to say so. It was only the upper part of the support that was reached – not the lowest point, so the implications are only somewhat bullish (…)
The reversals in crude oil are important, especially when accompanied by high volume, but only after a sizable decline. The reversals in February and August, for instance were both followed by much higher prices, but the reversal in the second half of May that was seen after only a small move lower, wasn’t – it marked the moment when a short-term horizontal trend has begun and nothing more. We can say the same about the early-June reversal. Consequently, it may not be the case that a sharp rally will follow, but that instead we will see some sideways movement for some time (back and forth trading between $45 and $52). If we see major bullish or bearish confirmations, we’ll keep you informed.
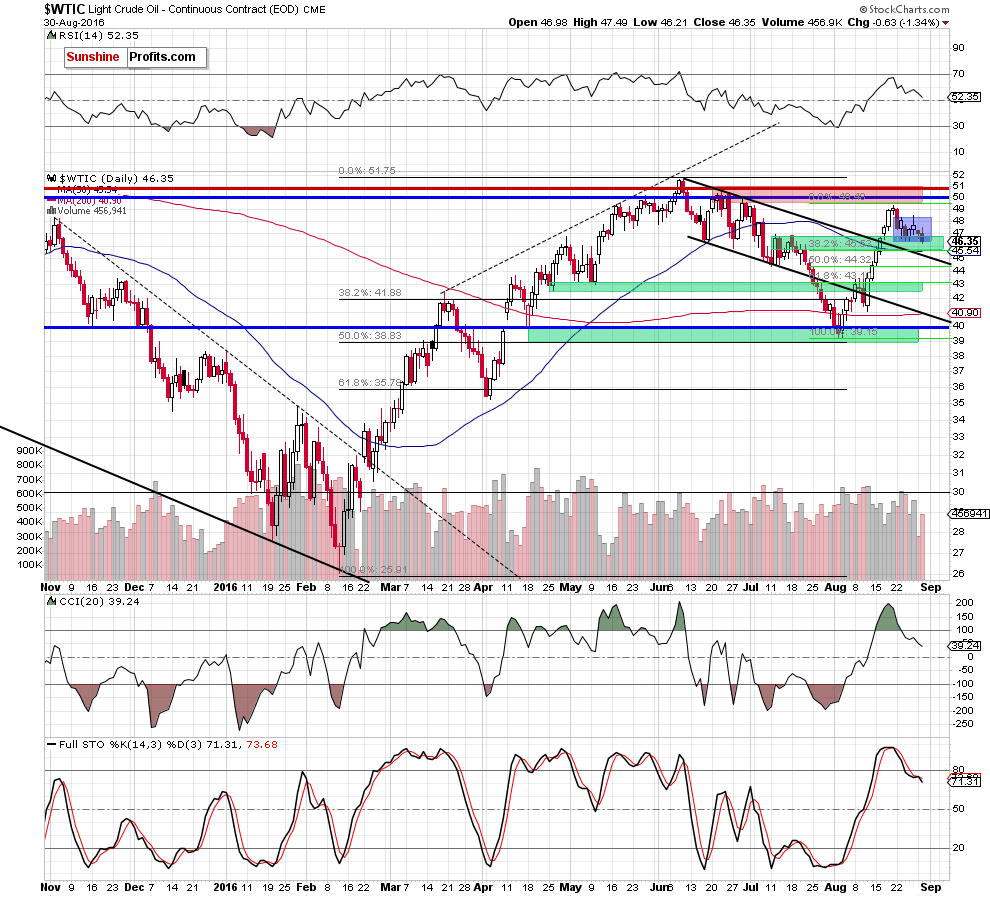
Crude oil has indeed moved sideways since that time, however, on average crude oil moved lower. As far as the shape of the move is concerned, we saw an ABC pattern (or a zigzag), which is quite often seen as a consolidation / a pause. The thing that changed based on yesterday’s move lower and today’s decline is that the lower border of the support area is being reached.
The support is created by more than one line:
- the July tops
- the recent August low
- the 38.2% Fibonacci retracement based on the August rally
- the 50-day moving average (it was not too effective as support, though)
- the upper border of the previously broken declining trend channel.
At the moment of writing these words, crude oil is trading at $45.84 – below $46 and well below the level at which we exited the previous long positions (August 22; previous day’s close was $49.11). We are very close or right at the above-mentioned support levels and it appears that at least a temporary rally will follow.
With pennies to the downside (the lowest of the above-mentioned support levels is at about $45) and dollars to the upside (it seems that crude oil will move at least (!) to the $50 level), it appears that a speculative long position is now justified from the risk to reward point of view.
Very short-term outlook: bullish
Short-term outlook: bullish
MT outlook: mixed
LT outlook: mixed
Trading position (short-term; our opinion): Long positions (stop loss at $42.88; next upside target at $49.70) are justified from the risk/reward perspective.
We will keep you – our subscribers – informed should anything change.
As a reminder – “initial target price” means exactly that – an “initial” one, it’s not a price level at which we suggest closing positions. If this becomes the case (like it did in the previous trade) we will refer to these levels as levels of exit orders (exactly as we’ve done previously). Stop-loss levels, however, are naturally not “initial”, but something that, in our opinion, might be entered as an order.
Since it is impossible to synchronize target prices and stop-loss levels for all the ETFs and ETNs with the main market that we provide this level for (crude oil), the stop-loss level and target price for popular ETN and ETF (among other: USO, DWTI, UWTI) are provided as supplementary, and not as “final”. This means that if a stop-loss or a target level is reached for any of the “additional instruments” (DWTI for instance), but not for the “main instrument” (crude oil in this case), we will view positions in both crude oil and DWTI as still open and the stop-loss for DWTI would have to be moved lower. On the other hand, if crude oil moves to a stop-loss level but DWTI doesn’t, then we will view both positions (in crude oil and DWTI) as closed. In other words, since it’s not possible to be 100% certain that each related instrument moves to a given level when the underlying instrument does, we can’t provide levels that would be binding. The levels that we do provide are our best estimate of the levels that will correspond to the levels in the underlying assets, but it will be the underlying assets that one will need to focus on regarding the sings pointing to closing a given position or keeping it open. We might adjust the levels in the “additional instruments” without adjusting the levels in the “main instruments”, which will simply mean that we have improved our estimation of these levels, not that we changed our outlook on the markets.
Thank you.
Nadia Simmons
Forex & Oil Trading Strategist
Przemyslaw Radomski, CFA
Founder, Editor-in-chief, Gold & Silver Fund Manager
Gold & Silver Trading Alerts
Forex Trading Alerts
Oil Investment Updates
Oil Trading Alerts

