
Trading position (short-term; our opinion): Long positions with a stop-loss at $72.78 (however, we think opening the position is only justified in the final minutes of today’s session, if crude oil remains above $74.20).
On Thursday, crude oil lost 3.39% as weaker-than-expected Chinese data and ongoing worries over a glut in oil market weighed on the price. As a result, light crude broke below two support lines and reached the 50% Fibonacci retracement. Wil it withstand the selling pressure and we’ll see a rebound in the coming days?
Yesterday, the National Bureau of Statistics of China reported that Chinese industrial production fell to 7.7% in October, missing analysts’ expectations for unchanged growth at 8.0%. These disappointing numbers sparked concerns that the world's second-largest consumer of oil may be battling increasing headwinds, which could translate to weaker demand. On top of that, indications that the Organization of the Petroleum Exporting Countries will not cut output to support the price of light crude also pushed the commodity lower. In these circumstances, crude oil moved sharply lower and reached the key support level. Will it encourage oil bulls to act? (charts courtesy of http://stockcharts.com).
In our Oil Trading Alert posted on Nov 4, we wrote the following:
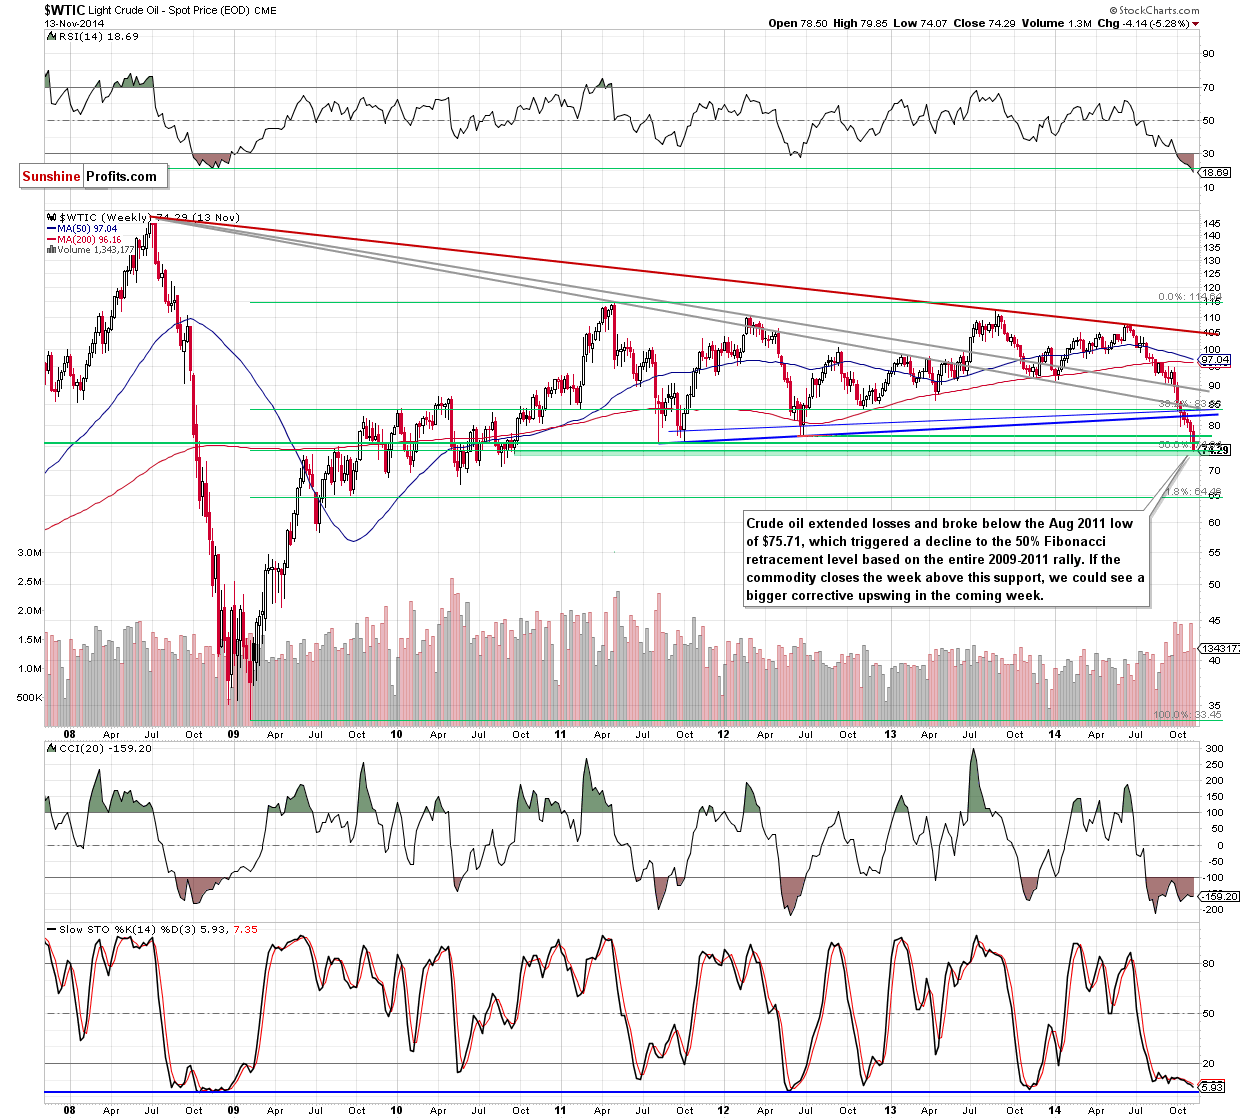
(…) How low could the commodity go? (…) oil bulls may find support around (…) $75.71 (the Aug 2011 low). However, taking into account the (…) breakdown below the lower border of the consolidation, it seems that crude could drop even to around $75, where the size of the downward move will correspond to the height of the formation. At this point, it’s worth noting that below this level there is also the 50% Fibonacci retracement based on the entire 2009-2011 rally (at $74.19), which together create a solid support zone.
Looking at the weekly chart, we see that oil bears pushed crude oil lower and realized the above-mentioned scenario yesterday. With this downswing, the commodity hit a fresh multi-year low of $74.07, but rebounded slightly in the following hours and came back above the 50% Fibonacci retracement. Although this is a positive signal, it’s too early to say that the final bottom is in. In our opinion, the situation in the medium term will improve, if light crude closes the week above this key support level.
Having say that, let’s check how yesterday’s move affected the very short-term picture.
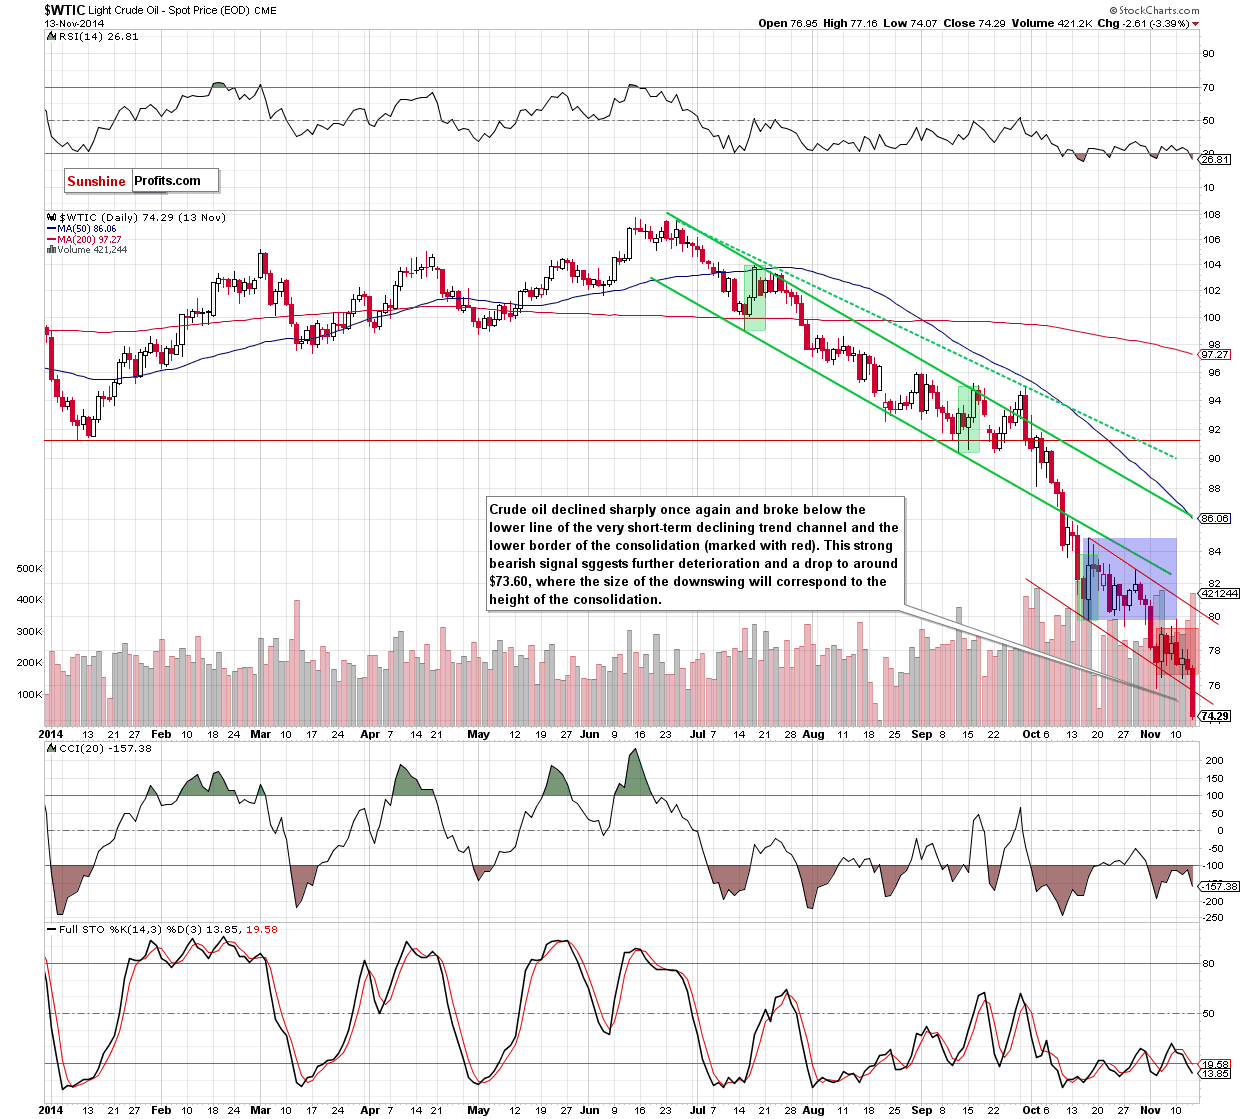
The first thing that catches the eye on the above chart is a breakdown below the lower border of the consolidation (marked with red) and the lower line of the declining trend channel. This is a strong bearish signal that suggests further deterioration. Nevertheless, we should keep in mind that even if we see another drop, the most important factor that could influence future’s moves will be the weekly closing price. The reason? If we see a breakdown under the 50% Fibonacci retracement, it would be a strong bearish sign, which could trigger further deterioration – even to around $70, where the next psychological barrier and the Aug 2010 low are. On the other hand, if the commodity invalidates the breakdown below this key support, closing above $74.20, it would be a bullish signal, which could signal a trend reversal.
Summing up, the most important event of yesterday’s session was a small breakdown below the 50% Fibonacci retracement and its invalidation in the following hours. As we have pointed out before, this is a positive signal, however, as long as there is no weekly close above this level, another attempt to move lower is likely.
Very short-term outlook: mixed
Short-term outlook: mixed
MT outlook: mixed
LT outlook: bullish
Trading position (short-term; our opinion): Long positions with a stop-loss at $72.78 (however, we think opening the position is only justified in the final minutes of today’s session, if crude oil remains above $74.20). We will keep you informed should anything change, or should we see a confirmation/invalidation of the above.
Thank you.
Nadia Simmons
Forex & Oil Trading Strategist
Przemyslaw Radomski, CFA
Founder, Editor-in-chief
Gold & Silver Trading Alerts
Forex Trading Alerts
Oil Investment Updates
Oil Trading Alerts

