
Trading position (short-term; our opinion): Long positions (bought automatically based on yesterday’s alert at $75.82) and a stop-loss at $73.47 (target price: $82.78) are justified from the risk/reward perspective.
Despite today’s early-session decline, not much changed on the crude oil market so far this month. Since there were no big upswings or downswings for us to comment on (well, despite today’s move), in addition to commenting on today’s price changes, we’ll take a step back and focus on something different – the current trend.
Since the price of crude oil has been moving back and forth this month, the question is if this month’s horizontal trend is the new state of the market that is going to persist for considerable time, or is this pause likely to end relatively soon. Let’s start with the short-term chart (charts courtesy of http://stockcharts.com).
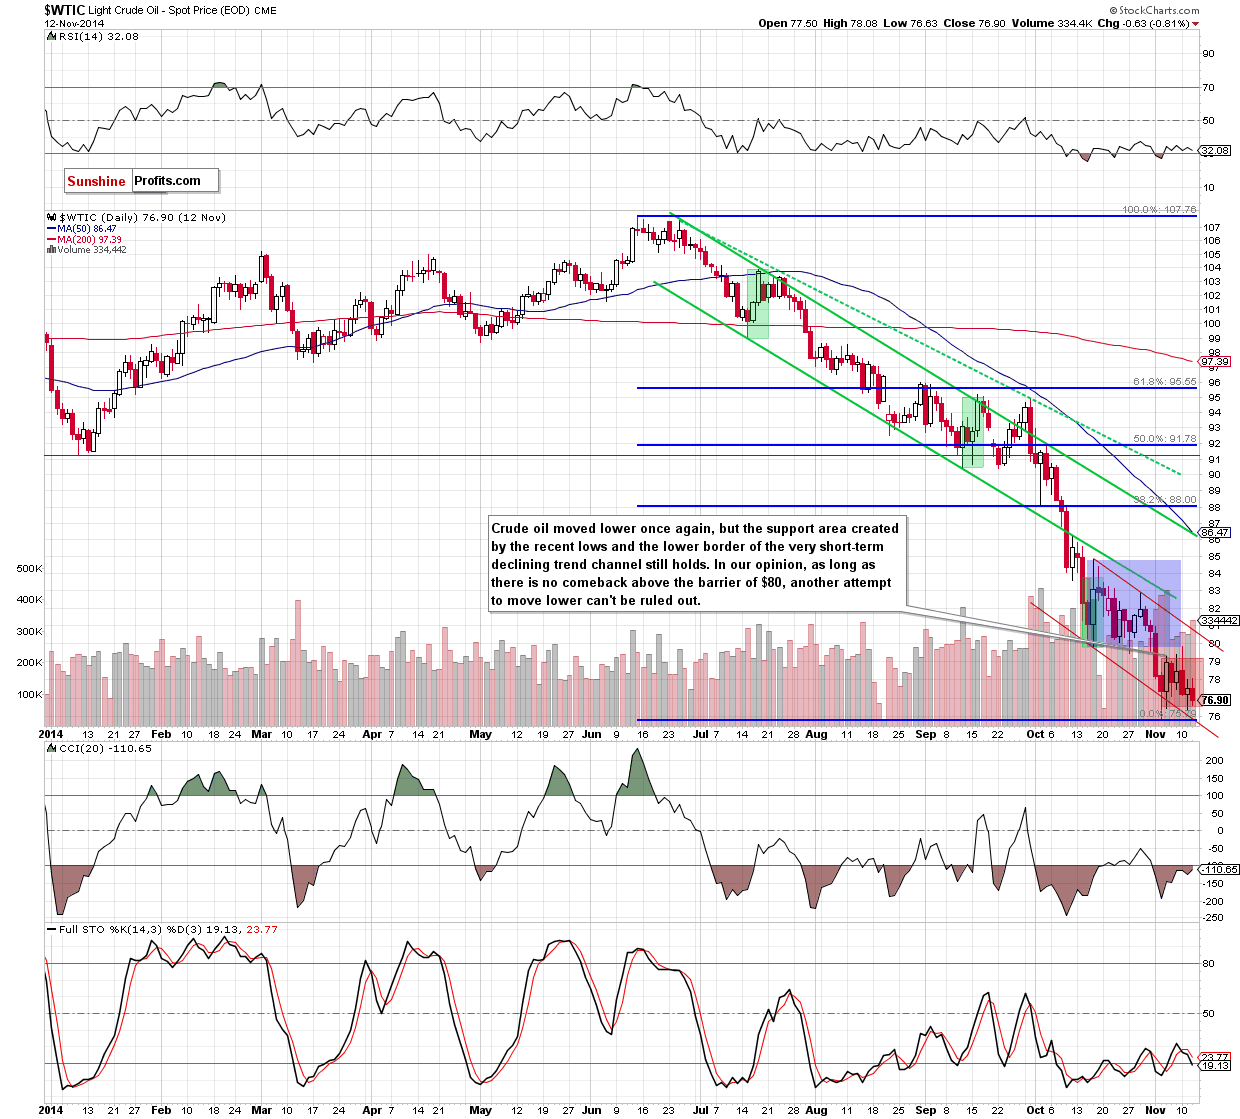
The back and forth movement is actually a horizontal trend into account only if we consider this month only. If we take into account the previous month as well, we see that the most recent price movement is really a post-decline pause. Please note that the volume declined when crude oil started trading sideways, which is typical for consolidations. Today’s session (crude oil declined about $1.50 at the moment of writing these words) also confirms that the previous price swings that we’ve seen this month was just a pause.
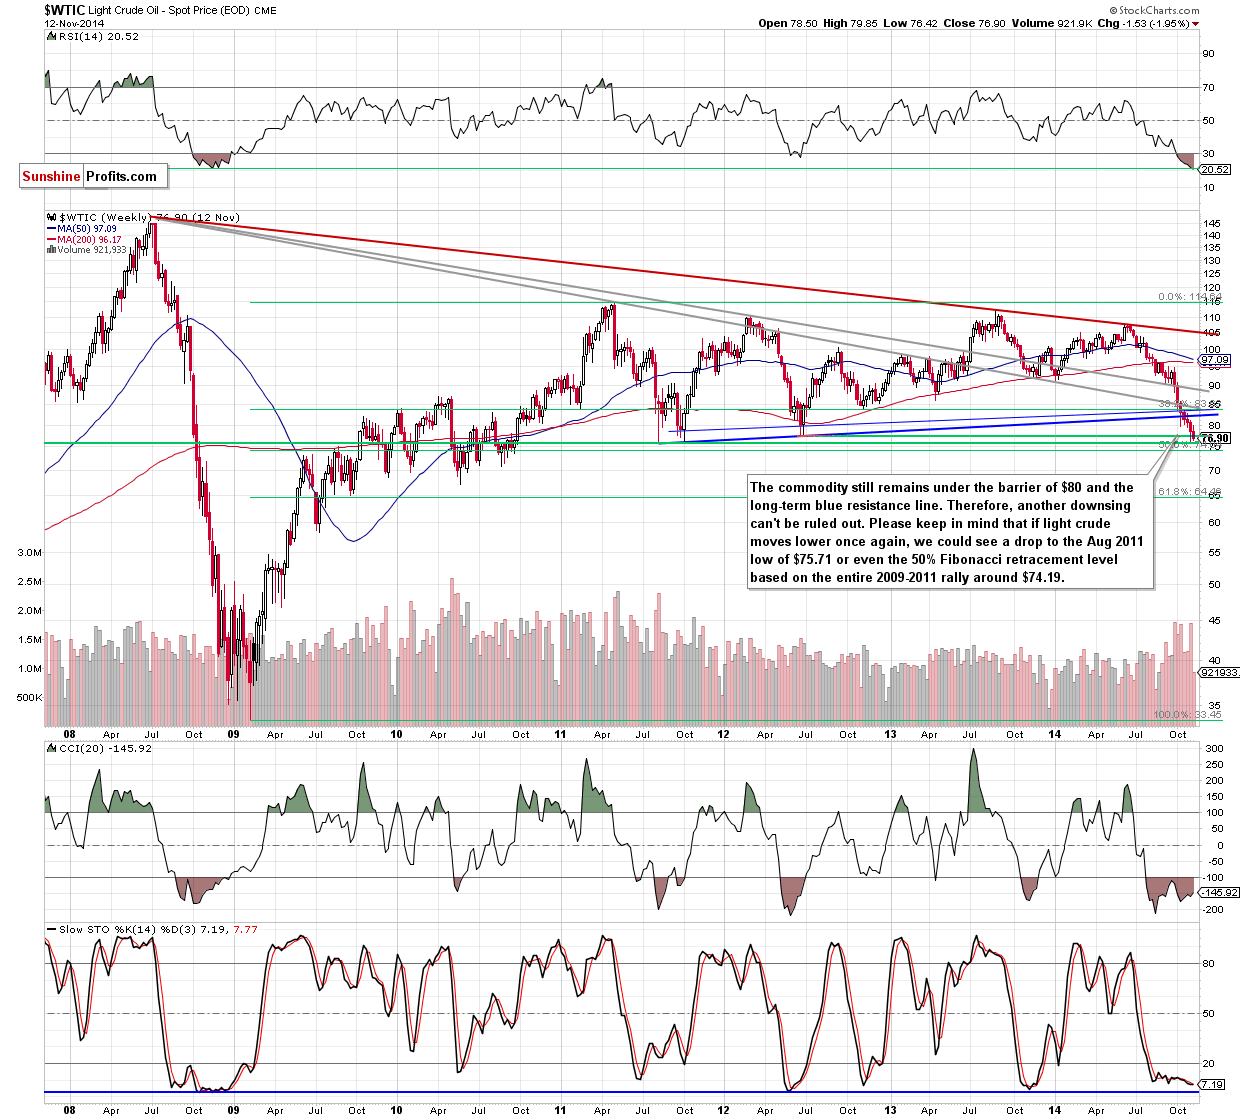
From the long-term point of view, this month’s pause is not even visible. Crude oil has been declining for months and the decline accelerated in October. Given the latter, it’s no surprise that the market had to take a breather before the decline could continue (which it seems to be doing today).
So, the most recent price moves are most likely just a pause, and not a start of a horizontal trend. Can crude oil fall much further? Yes, but it’s not very likely to do so. As far as price targets are concerned, what we wrote yesterday, remains up-to-date:
(…) please keep in mind that even if crude oil extends losses in the coming days, the space for further declines seems limited as the solid support zone created by the Aug 2011 low of $75.71 and the 50% Fibonacci retracement level based on the entire 2009-2011 rally (at $74.19) is quite close.
Summing up, this month’s price action (or more precisely, lack thereof until today) is most likely a pause within a downswing, but the following decline is not likely to be huge and it seems that we can expect a bigger rebound in the coming weeks, since crude oil moved into mid-70s and touched important support levels.
Very short-term outlook: mixed
Short-term outlook: mixed
MT outlook: mixed
LT outlook: bullish
Trading position (short-term; our opinion): Long positions with a stop-loss at $73.47 (target price: $82.78) are justified from the risk/reward perspective. We will keep you informed should anything change, or should we see a confirmation/invalidation of the above.
Thank you.
Nadia Simmons
Forex & Oil Trading Strategist
Przemyslaw Radomski, CFA
Founder, Editor-in-chief
Gold & Silver Trading Alerts
Forex Trading Alerts
Oil Investment Updates
Oil Trading Alerts

