

Trading position (short-term; our opinion): Short positions (with a stop-loss order at $54.51 and initial downside target at $45.43) are justified from the risk/reward perspective.
On Monday, crude oil gained 0.21% and hit a fresh 2016 high, but will we see further improvement in the coming week?
Let’s take a look at the charts below to find out (charts courtesy of http://stockcharts.com).
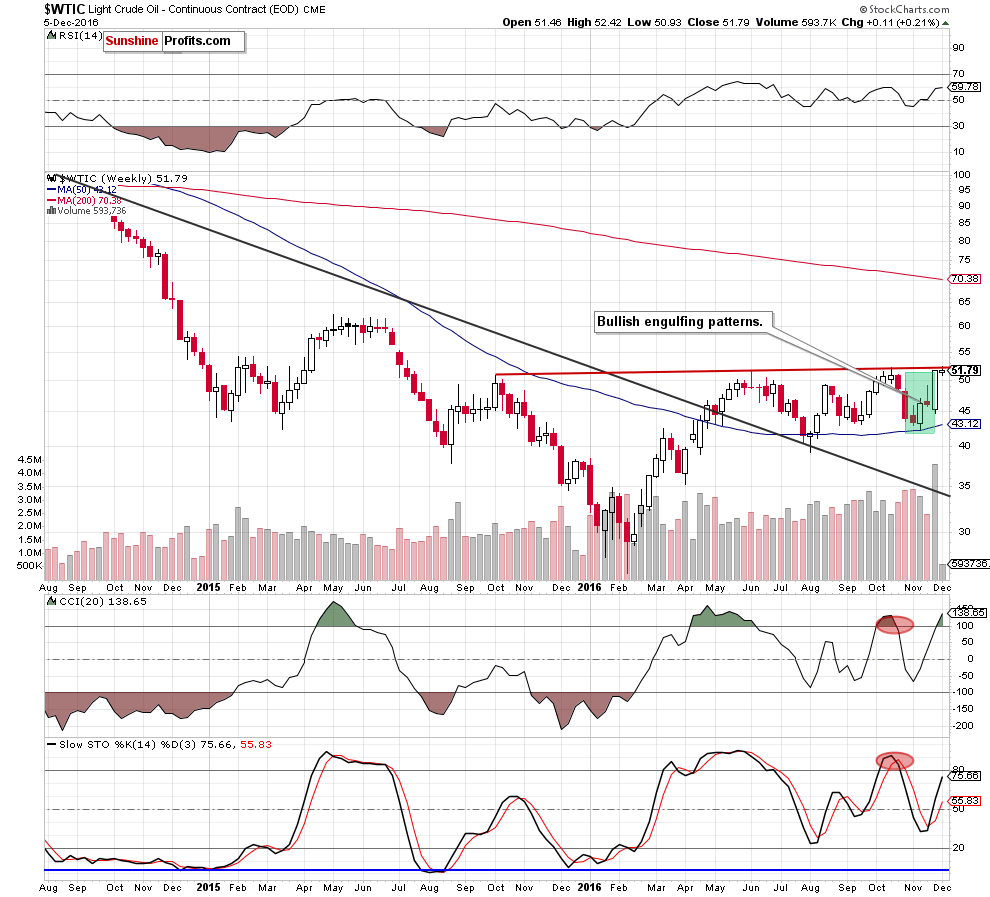
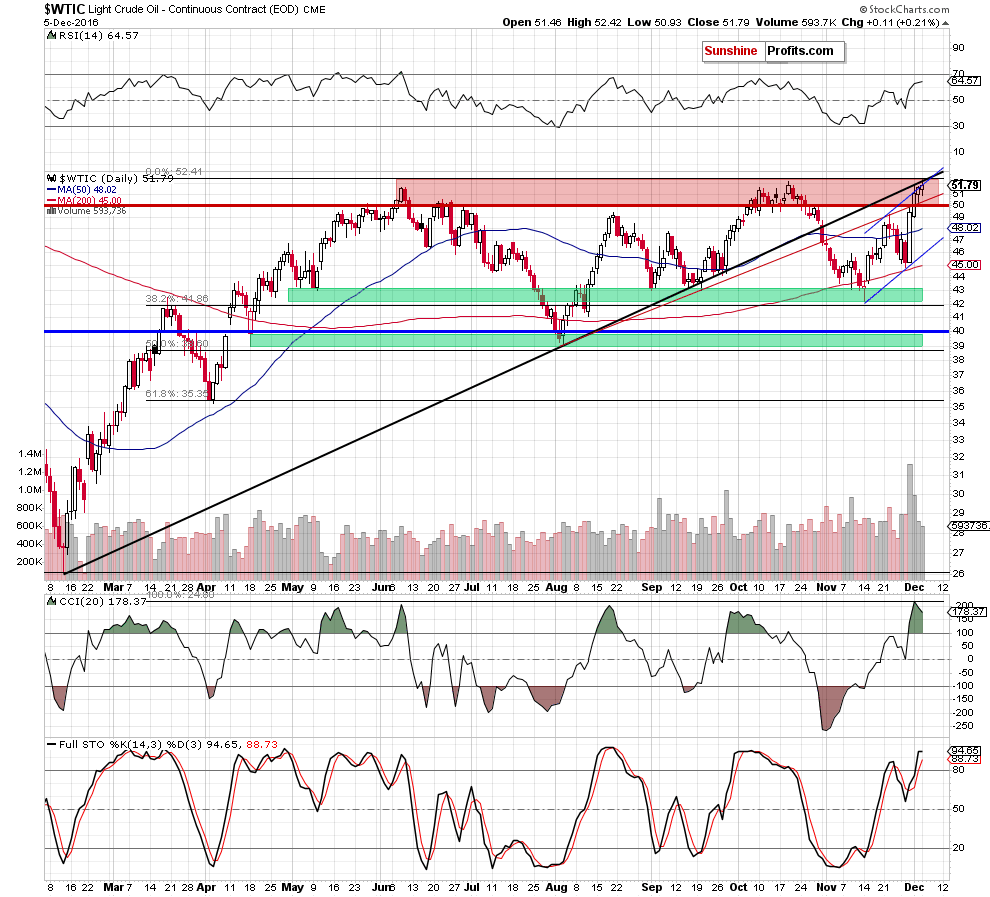
Looking at the above charts, we see that although crude oil extended gains and hit a fresh 2016 high of $52.42, the combination of the long-term red resistance line based on the previous peaks (marked on the weekly chart) and the medium-term black resistance line based on the Feb and Aug lows (seen on the daily chart) stopped oil bulls. As a result, the commodity pulled back, which took the price not only under the previously-broken Oct peak, but also below the upper border of the blue rising trend channel, which means an invalidation of earlier breakouts.
Such price action doesn’t bode well for the commodity – especially when we factor in the fact that yesterday’s increase materialized on a smaller volume once again (as a reminder, the size of volume that accompanied recent increases (since Wednesday) has steadily decreased, which suggests that the rally can go without steam). Additionally, the CCI and Stochastic Oscillator climbed to the highest levels since Oct, which increases the probability of reversal in the coming days.
This pro bearish scenario is reinforced by the current picture of the oil-to-gold ratio.

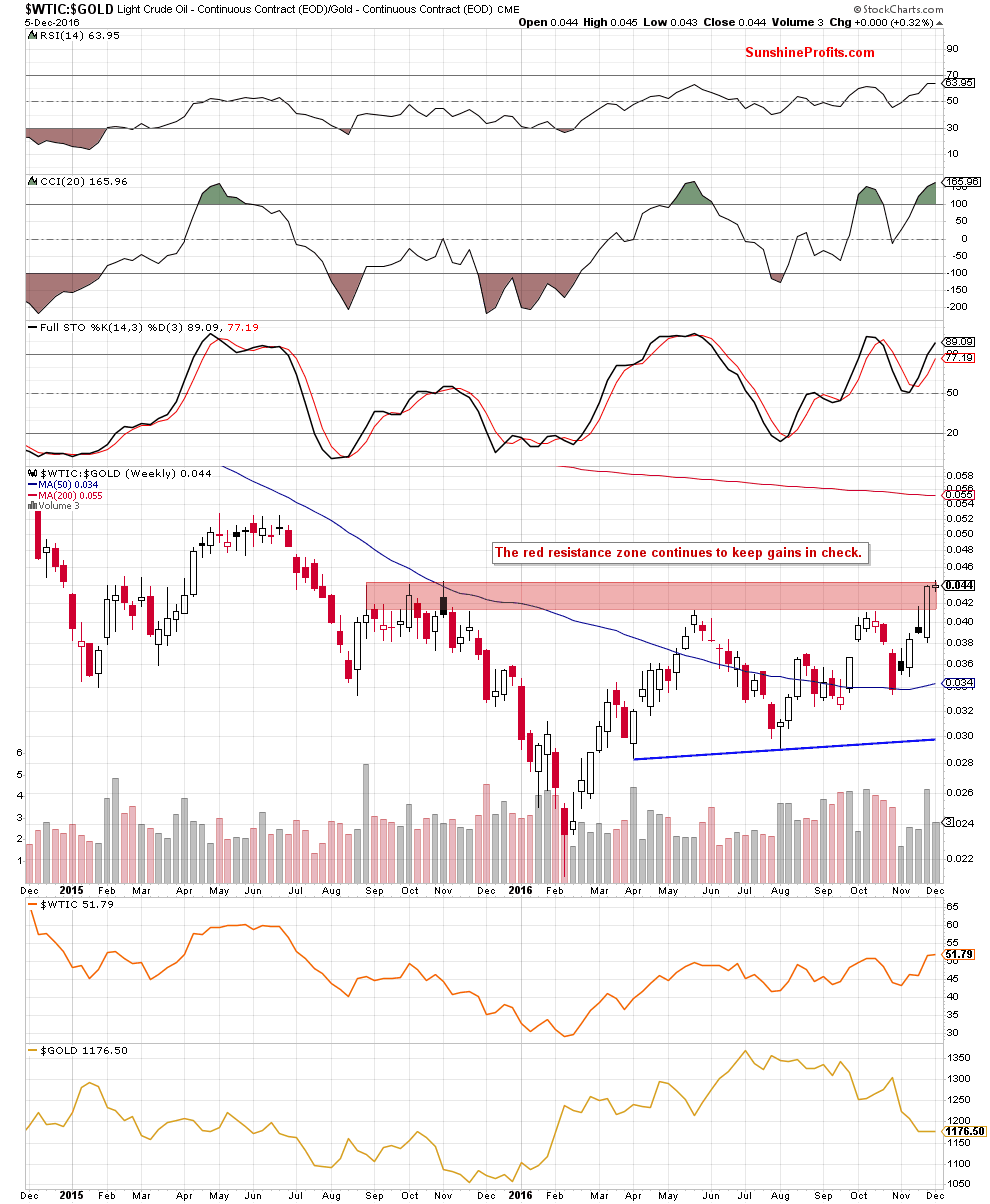
On the long- and medium-term charts, we see that the ratio reached the upper border of the red zone, which is the key resistance at the moment. Therefore, even if we see another attempt to move higher, in our opinion, the space for gains seems limited as the late 2015 highs and the 38.2% Fibonacci retracement (based on the 2013-2016 downward moves) are very close to the current position of the ratio. As you see, this area was strong enough to stop increases in May and also in Oct, which suggests that we may see similar price action in very near future.
Additionally, this scenario is also supported by the very short-term picture.
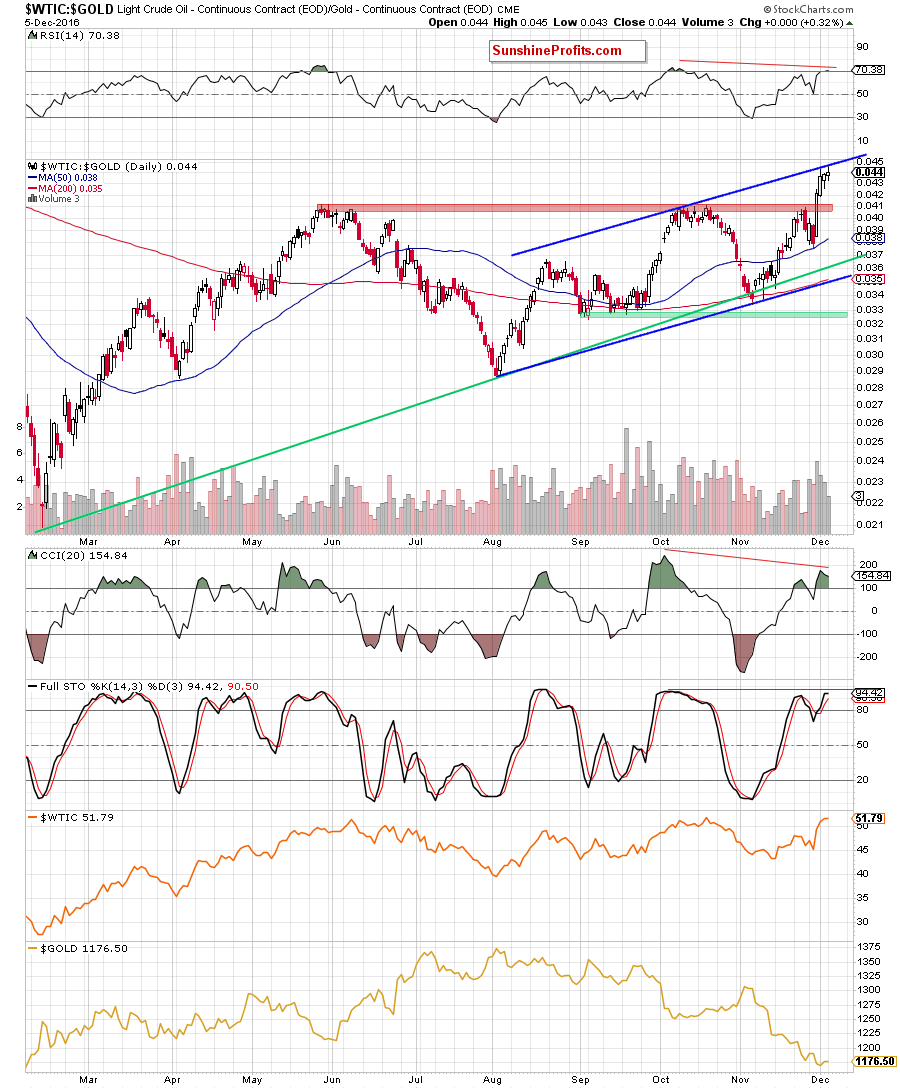
From this perspective, we see that the oil-to-gold ratio climbed to the upper line of the blue rising trend channel, which in combination with the current position of the indicators (the RSI moved above the level of 70 and there are negative divergences between all indicators and the ratio) and decreasing volume during recent increases suggests that reversal and lower values of the ratio are just around the corner.
What does it mean for crude oil? Taking into account a strong positive correlation between the ratio and the commodity, we believe that lower prices of black gold are very likely in the coming week(s). Therefore, we believe that opening short positions is justified from the risk/reward perspective at the moment.
If we see a correction of the recent rally, the initial downside target would be the previously-broken red line based on the Aug and Sep lows, the Nov 22 high of $49.20 or even the 50-day moving average.
Summing up, although crude oil hit a fresh 2016 high, the medium-term black resistance line based on the Feb and Aug lows and the long-term red resistance line based on the previous peaks continue to keep gains in check, which means that as long as there won’t be a breakout above them further rally is not likely to be seen.
Very short-term outlook: bearish
Short-term outlook: mixed with bearish bias
MT outlook: mixed
LT outlook: mixed
Trading position (short-term; our opinion): Short positions (with a stop-loss order at $54.51 and initial downside target at $45.43) are justified from the risk/reward perspective. We will keep you – our subscribers – informed should anything change.
Thank you.
Nadia Simmons
Forex & Oil Trading Strategist
Przemyslaw Radomski, CFA
Founder, Editor-in-chief, Gold & Silver Fund Manager
Gold & Silver Trading Alerts
Forex Trading Alerts
Oil Investment Updates
Oil Trading Alerts

