
Trading position (short-term; our opinion): In our opinion no positions are justified from the risk/reward perspective.
On Thursday, crude oil hit a fresh multi-month low of $92.50 as a disappointing HSBC preliminary reading of China's PMI fueled fears over a slowdown in the world's second largest oil consumer. Although upbeat U.S. economic data released later in the day erased some losses, the commodity still remains below the recent lows. Will we see a test of the strength of the 2014 low in the coming days?
Yesterday, official data showed that the preliminary reading of China’s HSBC manufacturing index fell to a three-month low of 50.3 in August from 51.7 in July and well short of forecasts for 51.5. These disappointing numbers weighed on the investors’ sentiment and the price of crude oil declined to a fresh multi-month low of $92.50.
Despite this sharp drop, upbeat U.S. economic data released later in the day erased some of earlier losses. Please note that the Federal Reserve Bank of Philadelphia said that its manufacturing index increased to a three-year high of 28.0 this month from July’s reading of 23.9, while analysts had expected the index to decline to 19.2 in August. Additionally, the National Association of Realtors said that existing home sales increased 2.4% and hit a ten-month high of 5.15 million units last month from 5.03 million in June. On top of that, market research group Markit said that its preliminary U.S. manufacturing purchasing managers’ index increased to a four-year high of 58.0 this month from a final reading of 55.8 in July. Also yesterday, the U.S. Department of Labor reported that the number of individuals filing for initial jobless benefits decreased by 14,000 to 298,000 last week from the previous week’s total of 312,000.
These bullish numbers underlined optimism over the health of the U.S. economy and pushed the commodity higher. Will we see further improvement in the coming days? Or maybe the worst is not behind oil bulls? Let’s check the technical picture of light crude and find out (charts courtesy of http://stockcharts.com).
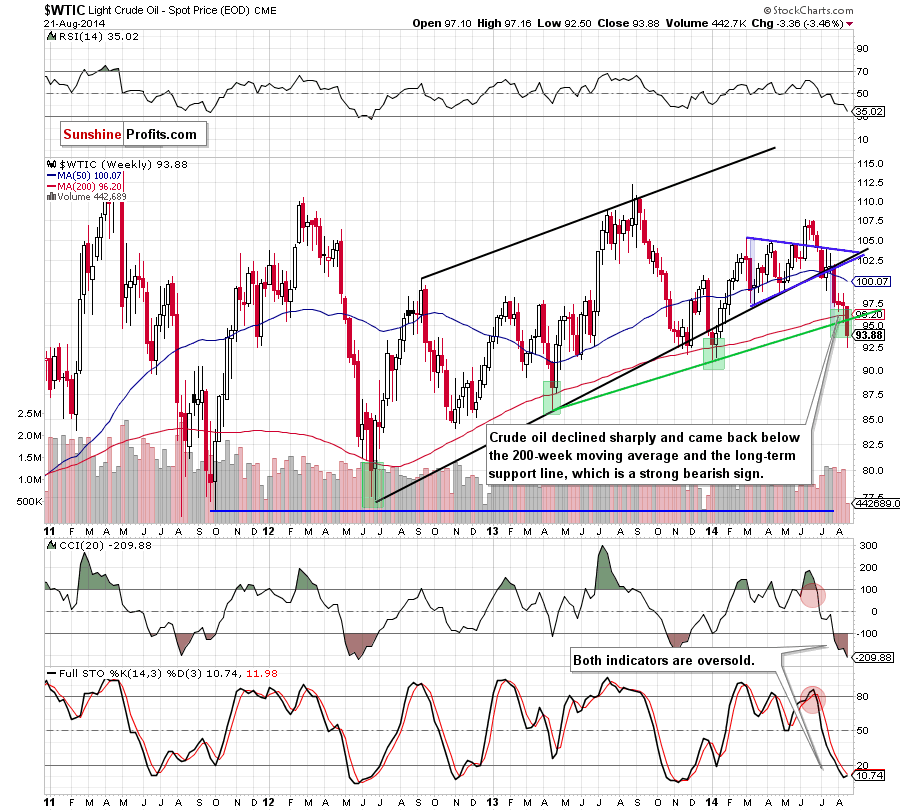
Looking at the above chart, we see that crude oil extended losses and came back below its major support levels - the 200-week moving average and the rising, long-term support line. This is a strong bearish signal, which suggests that if the commodity closes this week under these two important support levels, we’ll see further deterioration and a test of the strength of the January low of $91.24. Please note that although that the current position of the indicators suggests that a pause or a trend reversal is just around the corner, we think that as long as there are no buy signals, another attempt to move lower is more likely than not.
Can we infer something more from the daily chart? Let’s check.
Yesterday, we wrote the following:
(…) is the situation as bullish as it looks at the first sight? Not really. The main reason, which makes us skeptical is the size of the volume. As you can see on the above chart, it was even smaller than a day before, which suggests that yesterday’s upswing could not be an important reversal, but just a one-day rally (we saw a similar situation on Friday). Therefore, we think that it’s worth to wait for a confirmation/invalidation of the above before making investment decisions.
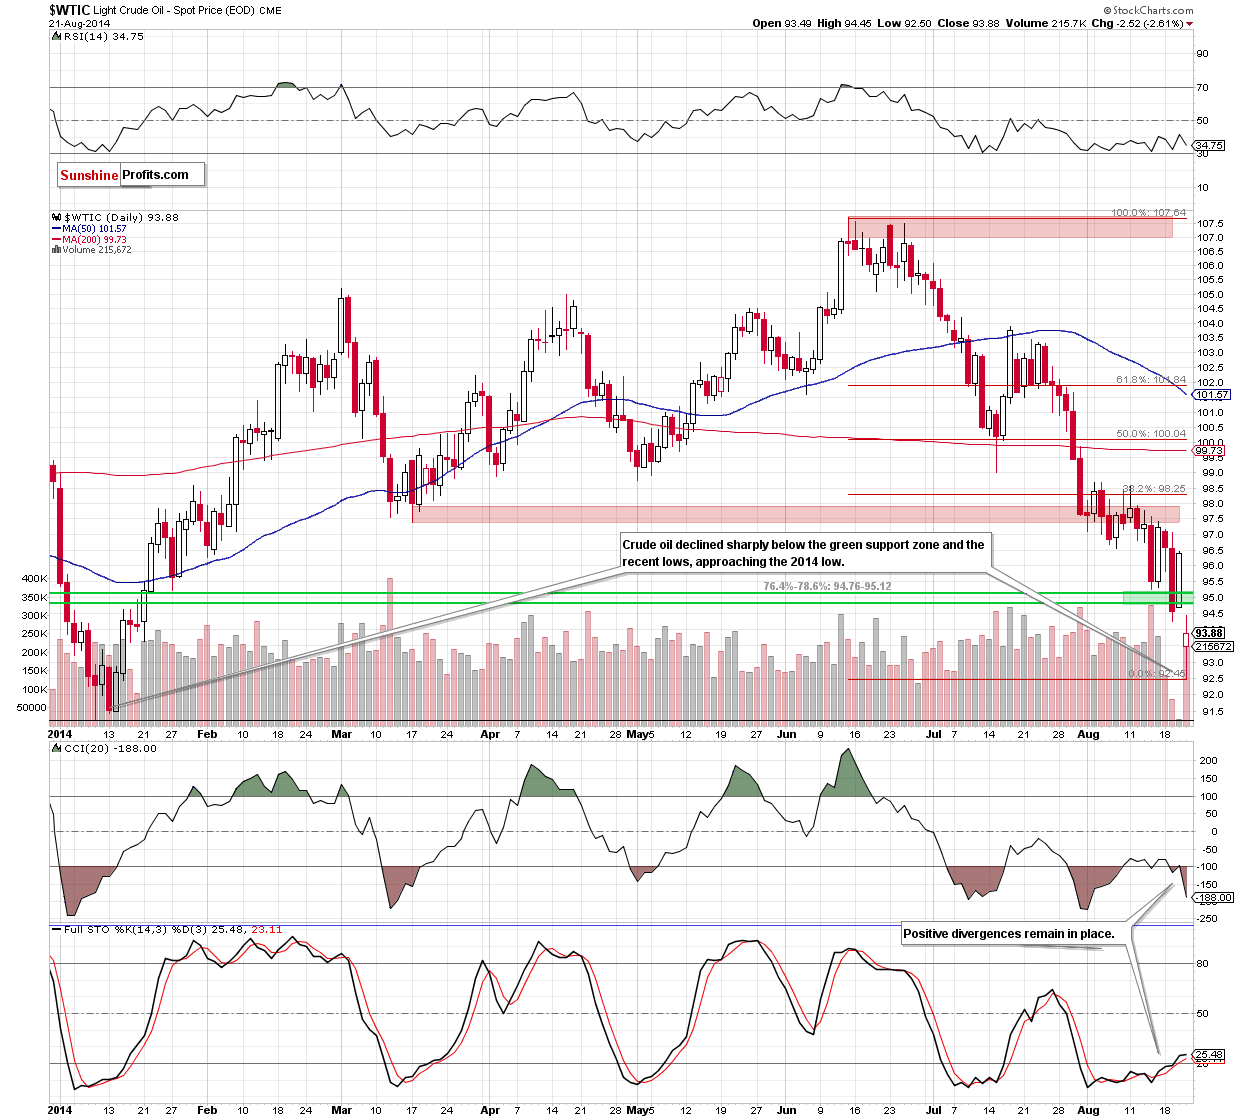
Looking at the above chart, we clearly see that despite Wednesday’s rally, crude oil declined sharply to a seven month low of $92.50, approaching the Jan low of $91.24. If the proximity to this important support level encourages oil bulls to act, we may see further improvement in the coming days. Nevertheless, taking into account the fact that yesterday’s upswing didn’t even push light crude above the previous lows, it seems to us that as long as there is no invalidation of the breakdown below the green support zone (which serves as the nearest resistance at the moment), another attempt to test the strength of the 2014 low can’t be ruled out.
Summing up, crude oil declined sharply and broke not only below the previous lows, but also under the 200-week moving average and the rising, long-term support line. This is a strong bearish signal, which suggests that if the commodity closes this week under these important levels, we’ll see further deterioration and a test of the strength of the January low of $91.24. Taking all the above into account, we still think that staying on the sidelines waiting for more valuable clues about the direction of future moves is the best choice at the moment.
Very short-term outlook: mixed
Short-term outlook: mixed
MT outlook: mixed
LT outlook: bullish
Trading position (short-term): No positions are justified from the risk/reward perspective at the moment, but we will keep you informed should anything change.
Thank you.
Nadia Simmons
Forex & Oil Trading Strategist
Przemyslaw Radomski, CFA
Founder, Editor-in-chief
Gold & Silver Trading Alerts
Forex Trading Alerts
Oil Investment Updates
Oil Trading Alerts

