

Trading position (short-term; our opinion): No positions are justified from the risk/reward perspective.
On Friday, crude oil gained 2.03% as hopes for an extension of an output cut deal by major producers continued to weigh on investors’ sentiment. Additionally, the U.S. dollar moved sharply lower, making crude oil more attractive for buyers holding other currencies. In this environment, light crude broke above the barrier of $50 and closed the week above it. Will we see higher prices of the commodity in the coming week?
Let’s take a closer look at the charts and find out (charts courtesy of http://stockcharts.com).
Quoting our Friday’s alert:
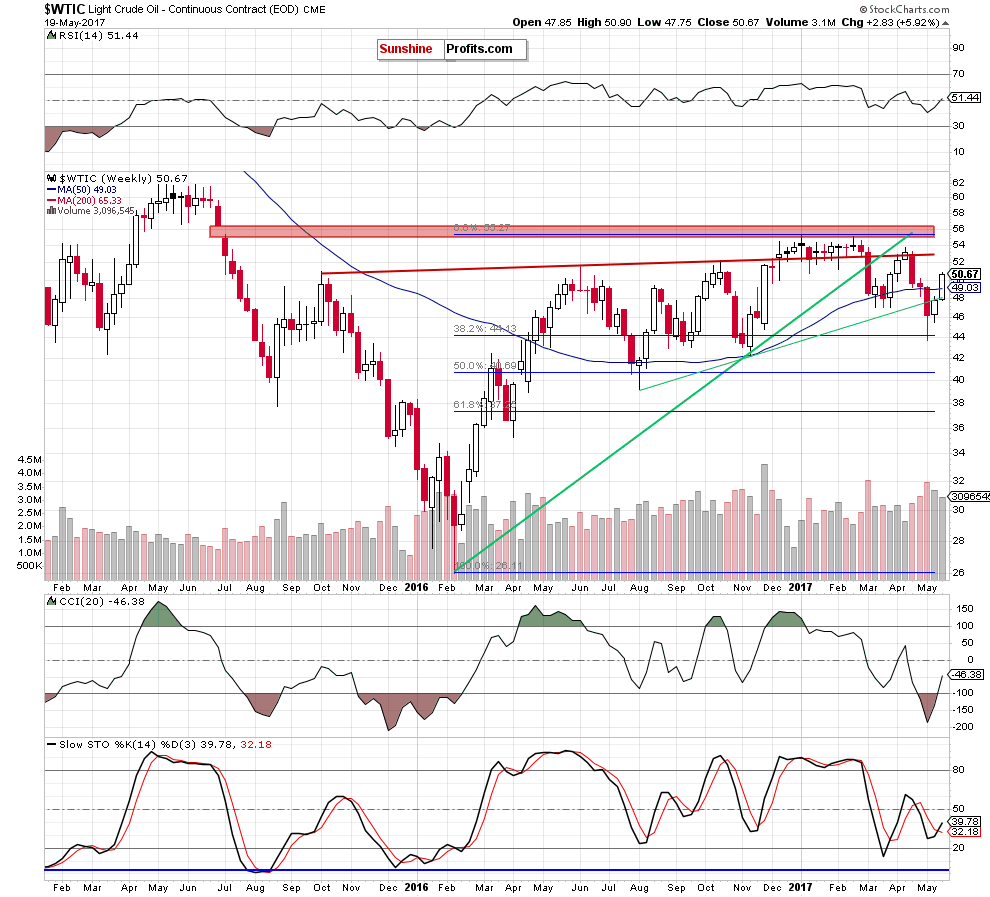
The first thing that catches the eye on the weekly chart is a comeback above the previously-broken 50-week moving average. Thanks to this increase crude oil invalidated the earlier breakdown, which together with the buy signals generated by the indicators suggests further improvement.
How high could the black gold go in the coming days?
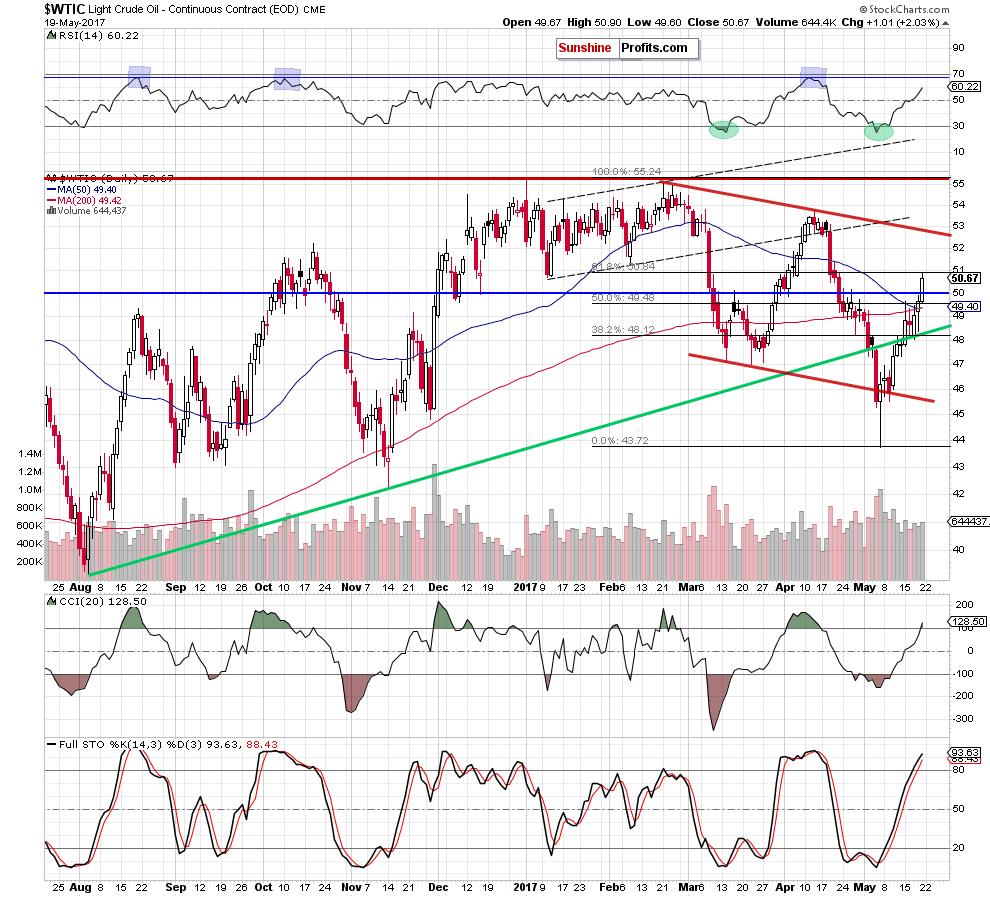
(…) the black god closed the day above the 50- and 200-day moving averages, which together with the breakout above the 50% Fibonacci retracement suggests a test of the barrier of $50 later in the day. If this resistance is broken, the next upside target for oil bulls will be around $50.85, where the 61.8% Fibonacci retracement based on the entire February-May downward move is.
From today’s point of view, we see that oil bulls pushed the black gold higher as we had expected. Thanks to their action, light crude broke above the barrier of $50, which triggered further improvement and resulted in a climb to our upside target - the 61.8% Fibonacci retracement based on the entire February-May downward move.
Although this is a bullish development, Friday’s upswing didn’t materialize on significant volume, which raises some doubts about the further strength of oil bulls. Additionally, the CCI and the Stochastic Oscillator climbed to their overbought areas, which could trigger sell signals in the coming week.
On top of that, when we take a closer look at the current situation in the oil-to-gold ratio we could see one more negative event.
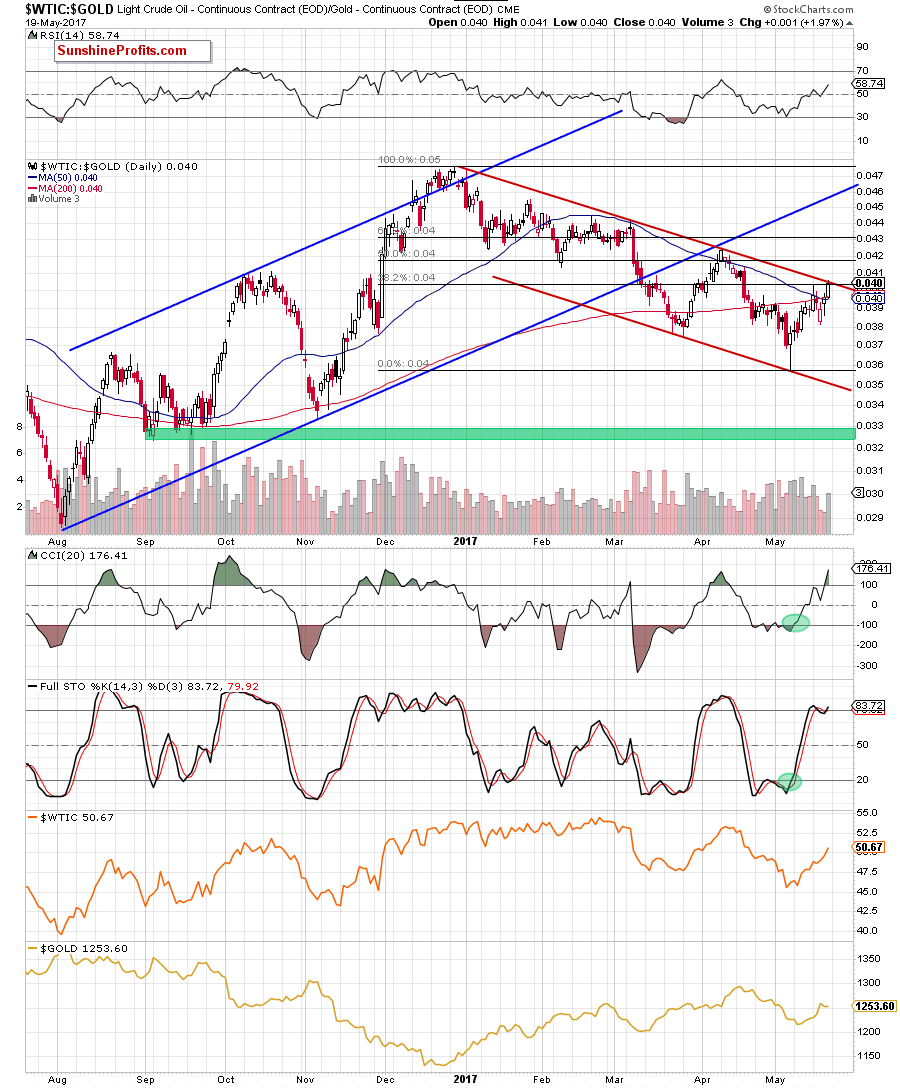
On the above chart, we see that although the ratio extended gains and climbed slightly above the 38.2% Fibonacci retracement based on the entire December-May downward move on Friday, the upper border of the medium-term red declining trend channel stopped oil bulls. When we take a closer look at the chart, we can notice a similar situation in April. Back then, a rebound to the above-mentioned resistance line triggered a decline, which took the ratio (and light crude) to fresh lows. Therefore if history repeats itself once again, we’ll likely see lower values of the ratio and crude oil in near future. This scenario is also reinforced by the daily indicators, which are overbought.
Summing up, crude oil extended gains, broke above the barrier of $50 and climbed to the 61.8% Fibonacci retracement. At the same time the oil-to-gold ratio increased to the upper border of the medium-term declining trend channel, which together with the current position of the daily indicators (in the ratio and crude oil) suggest that reversal may be just around the corner.
Very short-term outlook: mixed
Short-term outlook: mixed
MT outlook: mixed
LT outlook: mixed
Trading position (short-term; our opinion): No positions are justified from the risk/reward perspective. We will keep you – our subscribers – informed should anything change.
Thank you.
Nadia Simmons
Forex & Oil Trading Strategist
Przemyslaw Radomski, CFA
Founder, Editor-in-chief, Gold & Silver Fund Manager
Gold & Silver Trading Alerts
Forex Trading Alerts
Oil Investment Updates
Oil Trading Alerts

