
Trading position (short-term; our opinion): Speculative short positions in crude oil seem to be justified from the risk/reward perspective.
Although crude oil hit a fresh three-month high supported by expectations that the EIA data would show that U.S. supplies fell for a second straight week last week, the commodity reversed and finished the day with a loss of 0.25%. Thanks to these circumstances, crude oil invalidated a breakout above the medium-term resistance line. Are there any other bearish technical factors on the horizon?
In the previous week, the U.S. Energy Information Administration showed in its weekly report that crude oil stockpiles fell 3.4 million barrels in the week ended May 30, beating expectations of a 271,000-barrel decrease. Although these bullish numbers were largely due to higher refinery demand and a reduction in imports, expectations of a fall in crude oil supplies for a second straight week in the week to June 6. pushed crude oil to a fresh three-month high of $105.06. Despite this improvement, the commodity reversed as investors locked in gains from upbeat U.S. and Chinese data and jumped to the sidelines to await the fresh EIA weekly report.
What impact did it have on technical picture of crude oil? Let’s check (charts courtesy of http://stockcharts.com).
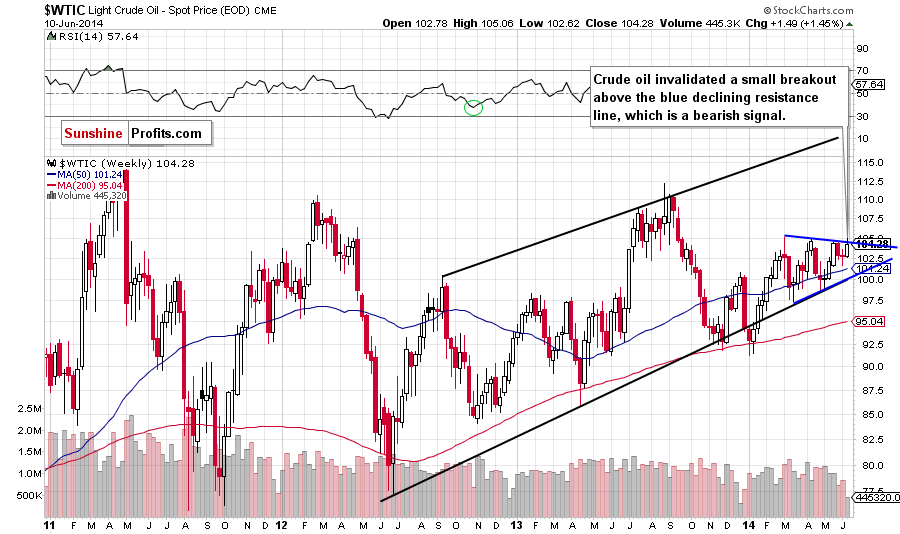
The first thing that catches the eye on the weekly chart is an invalidation of a breakout above the blue resistance line based on the recent highs (the upper border of the triangle). This is a bearish signal that suggests further deterioration. If this is the case, we will see another pullback (similarly to what we noticed in the previous weeks) and the downside target will be the 50-week moving average (currently at $101.24 – slightly below last week’s low).
Once we know the above, let’s check on the very short-term picture.
Quoting our previous Oil Trading Alert:
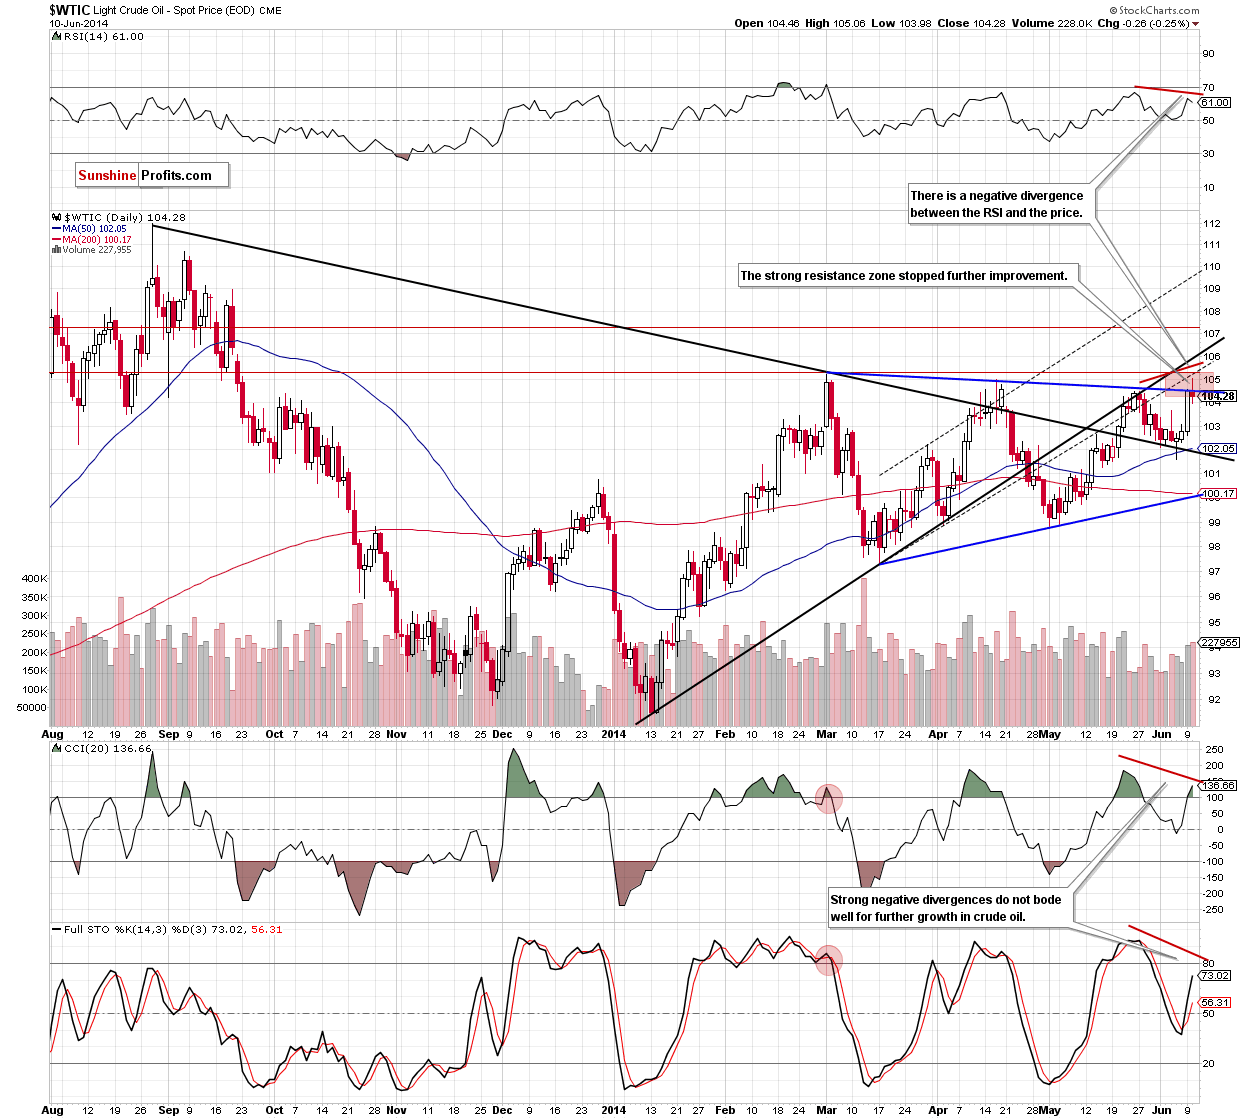
(...) even if oil bulls manage to push the price higher, it seems to us that the resistance zone (marked with red) created by the lower border of the rising trend channel, the medium-term rising black line and the April and March highs will be strong enough to stop futher improvement.
Yesterday, we noticed such price action as crude oil broke above the blue declining resistance line (the upper line of the medium-term triangle) and then reversed, declining below it. As we have pointed out before, this is a bearish signal, which suggests further deterioration. At this point, it’s also worth noting that there are negative divergences between the RSI, CCI, Stochastic Oscillator and the price of crude oil, which reinforce the bearish scenario at the moment. In our opinion, if crude oil decline from here, the initial downside target will be around $102.65, where the 38.2% Fibonacci retracement (based on the entire May-June rally) meets the Monday low. Please note that even if crude oil moves higher, we believe that the resistance zone (marked with red) will stop futher improvement.
Summing up, although crude oil hit a multi-month high, the commodity reversed, invalidating earlier breakout above the key-resistance line. Additionally, there are negative divergences between light crude and the indicators, which is another bearish signal. Taking these facts into account, it seems to us more likely than not that we’ll see a pullback from here and lower values of crude oil in the coming day (or days).
Very short-term outlook: bearish
Short-term outlook: bearish
MT outlook: mixed
LT outlook: mixed
Trading position (short-term): Short. Stop-loss order at $105.50. We will keep you informed should anything change, or should we see a confirmation/invalidation of the above.
Thank you.
Nadia Simmons
Forex & Oil Trading Strategist
Przemyslaw Radomski, CFA
Founder, Editor-in-chief
Gold & Silver Trading Alerts
Forex Trading Alerts
Oil Investment Updates
Oil Trading Alerts

