
Trading position (short-term; our opinion): Long positions with a stop-loss order at $89 are justified from the risk/reward perspective. Initial price target: $96.
On Wednesday, crude oil lost 0.77% as the combination of bearish the EIA weekly report and the Federal Reserve conclusion weighed on the price. Because of this circumstances, light crude pulled back and dropped below the key resistance line. Did this downswing change the very short-term picture?
Yesterday, the U.S. Energy Information Administration showed in its weekly report that U.S. crude oil inventories increased by 3.7 million barrels in the week ended Sept. 12, missing expectations for a decline of 1.7 million barrels, which sent the price of the commodity below $94 per barrel, fuelling worries over a supply glut.
Additionally, later in the day, light crude extended losses after the Federal Reserve concluded its two-day policy meeting. Fed officials cut monthly bond purchases by $10 billion, advancing the central bank's plans to close its quantitative easing program at its Oct. 28-29 meeting. In response, the U.S. dollar rallied against other currencies, making the commodity more expensive to foreign buyers. What impact did these circumstances have on crude oil’s technical picture? (charts courtesy of http://stockcharts.com).
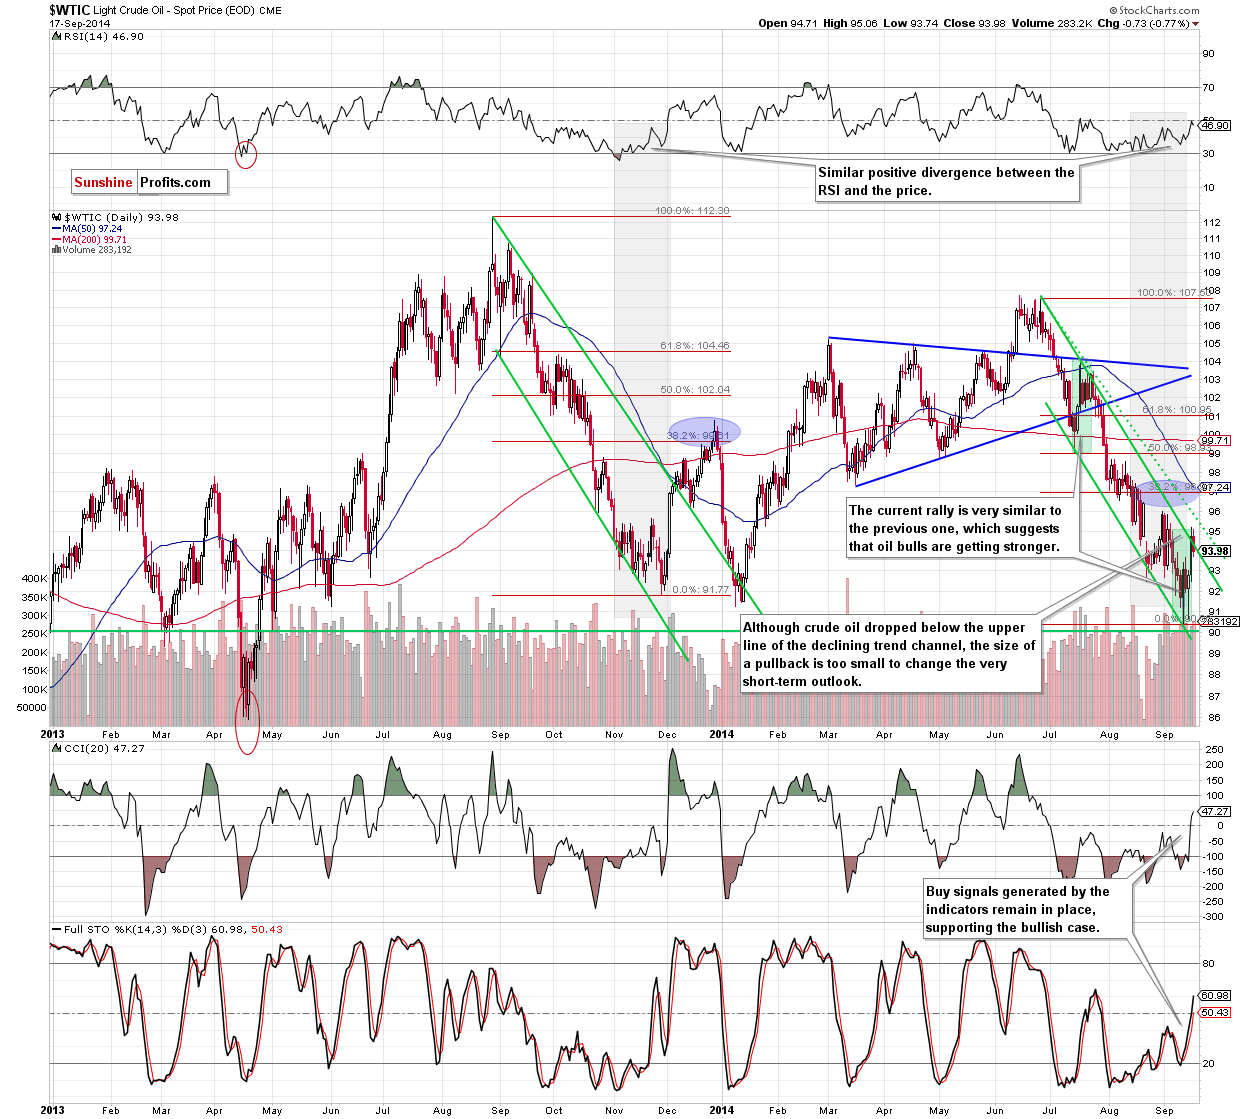
The situation in the medium term hasn’t changed much since our last commentary as crude oil is still trading between the support zone created by the long-term declining support line, the Jan low and the 61.8% Fibonacci retracement and the key resistance zone based on the previously-broken 200-day moving average and the long-term support/resistance line (currently around $96.15-96.40).
What can we infer from the daily chart? Let’s check.
Yesterday, we wrote the following:
(…) we should keep in mind that such sharp rallies are usually corrected on the following day as day-traders take profits. Therefore, a short-lived and shallow pullback from here should not surprise us.
As you see on the daily chart, situation developed in line with the above-mentioned scenario and crude oil corrected Tuesday’s rally. With this downswing, the exchange rate declined below the upper line of the declining trend channel , invalidating earlier small breakout. But is this as bearish signal as it looks at the first glance? In our opinion, not really. At this point, you may feel a little confused, because many times in our previous Oil Trading Alerts we wrote that an invalidation of a breakout is a negative signal. What’s different this time? When we consider the whole situation basing on the closing prices of notice that there was no breakout above the key resistance line as crude oil closed the day exactly on it. Therefore, yesterday’s pullback didn't bring an invalidation of the breakout and the very short-term outlook remains bullish.
Nevertheless, taking into account the uncertainty that might appear after today's analysis, we decided to attach two additional charts (well known to our Oil Investment Update’s readers), which will help dispel potential doubts about future moves.
Let’s start by focusing on the oil-stocks-to-oil ratio.
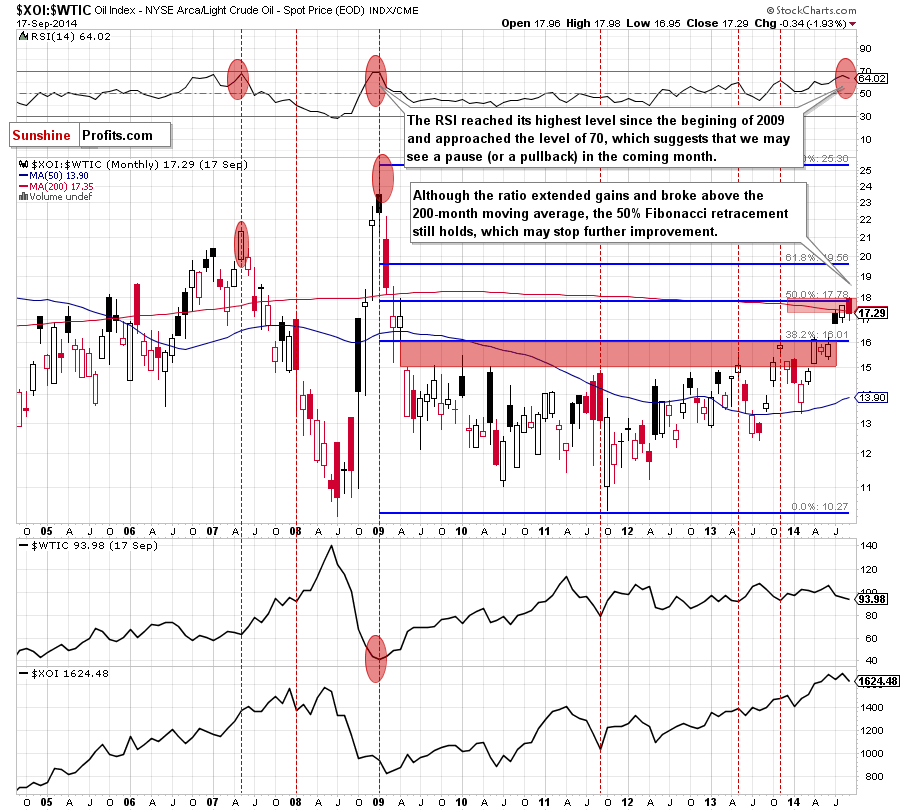
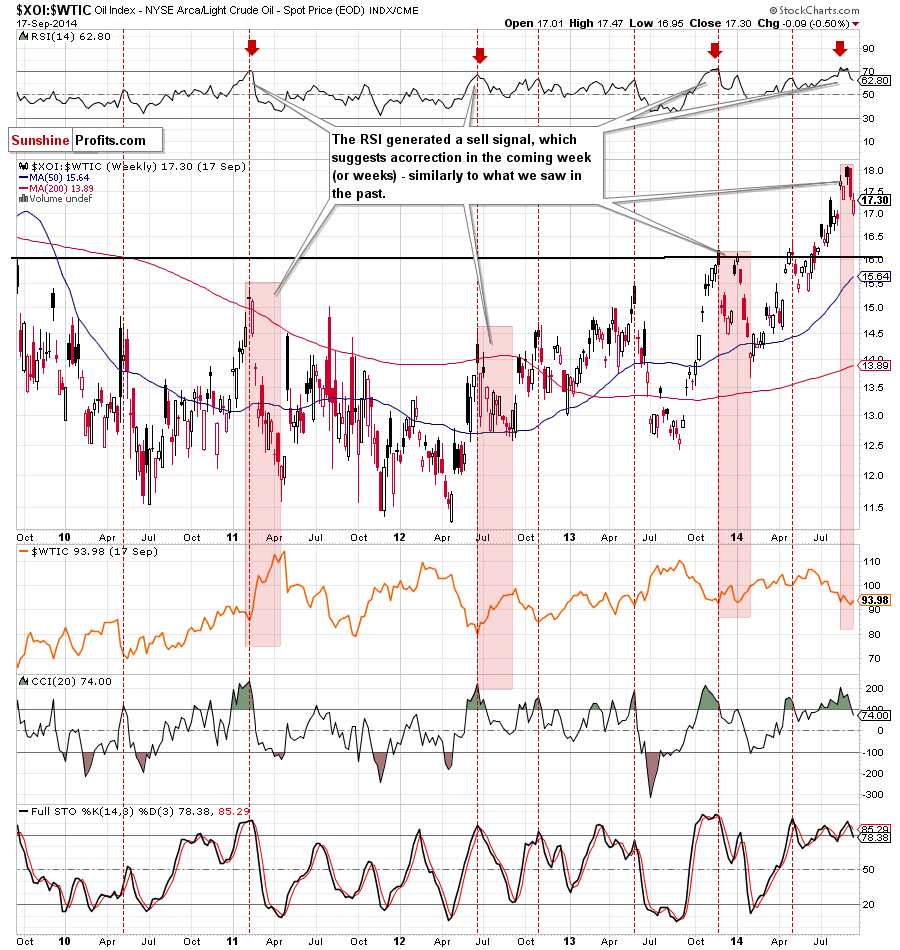
Looking at the above charts, we see that the 50% Fibonacci retracement triggered a corrective downswing, which took the ratio below the previously-broken 200-month moving average (a strong bearish signal). Taking into account the current position of the monthly RSI (which reached its highest level since the beginning of 2009) and combining it with sell signal generated by the weekly RSI, we believe that the next bigger move in the ratio will be to the downside. If this is the case, we may see a correction from here to the gap between June and July (16.40-16.81). What does it mean for crude oil? As you see on the above charts, many times in the past, the local tops in the ratio have corresponded to the local botoms in the commodity. We saw such situation in Jan. 2009, Sept. 2011, May 2013 and Nov. 2013. Therefore, we think that if the ratio declines from here, it will translate to higher values of crude oil.
Having say that, let’s examine the oil-to-stocks ratio.
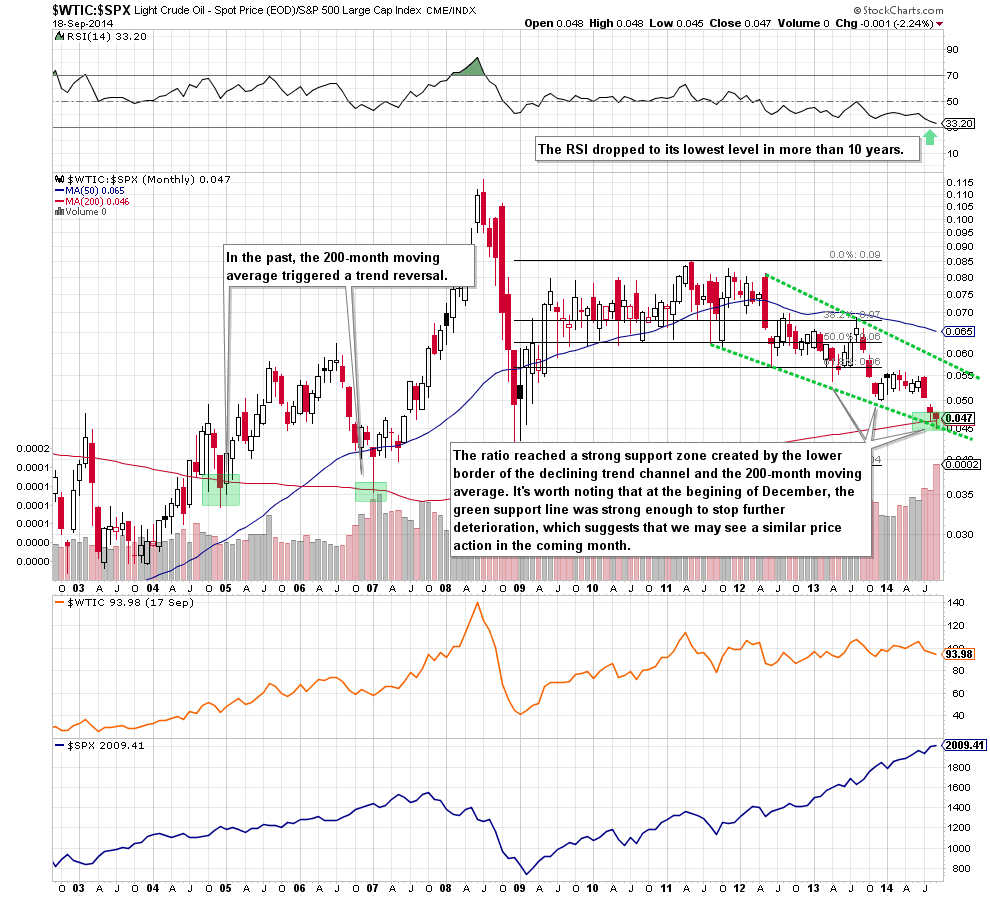
The first thing that catches the eye on the above chart is a drop to a strong support zone created by the lower border of the declining trend channel and the 200-month moving average. As you see on the monthly chart, this important moving average triggered a trend reversal at the begining of 2005 and also later in 2007. On top od that, the proximity to the green support line encouraged oil bulls to act in April 2013 and also at the end of the last year. Taking these facts into account and combining with the current position of the RSI (which dropped to its lowest level in more than 10 years), it seems to us that this area will be strong enough to stop further deterioration in the ratio, which should bring a rebound in crude oil.
Summing up, although crude oil moved little lower, yesterday’s pullback didn’t change the very short-term outlook, which remains bullish. Additionally, the picture that emerges from the ratios’ analysis is optimistic for oil bulls. Therefore, we believe that keeping long positions (which are still profitable) is justified from the risk/reward perspective.
Very short-term outlook: bullish
Short-term outlook: mixed with bullish bias
MT outlook: bearish
LT outlook: bullish
Trading position (short-term): Long with a stop-loss order at $89. We will keep you informed should anything change, or should we see a confirmation/invalidation of the above.
Thank you.
Nadia Simmons
Forex & Oil Trading Strategist
Przemyslaw Radomski, CFA
Founder, Editor-in-chief
Gold & Silver Trading Alerts
Forex Trading Alerts
Oil Investment Updates
Oil Trading Alerts

