

Trading position (short-term; our opinion): Short positions (with a stop-loss order at $35.63 and a price target at $25.63) are justified from the risk/reward perspective.
On Monday, crude oil moved sharply higher after the IEA report. As a result, the commodity climbed above $33 and reached the key resistance zone. What does it mean for light crude?
Yesterday, the International Energy Agency predicted in its report that U.S. crude production will continue to decline as prices remain around record-lows. The IEA said that U.S. light, thick oil will drop 600,000 barrels per day this year, before declining by another 200,000 bpd in 2017. These numbers encouraged oil investors to act, which resulted in a rally above $33. What does it mean for light crude? Let’s take a look at the charts (charts courtesy of http://stockcharts.com).
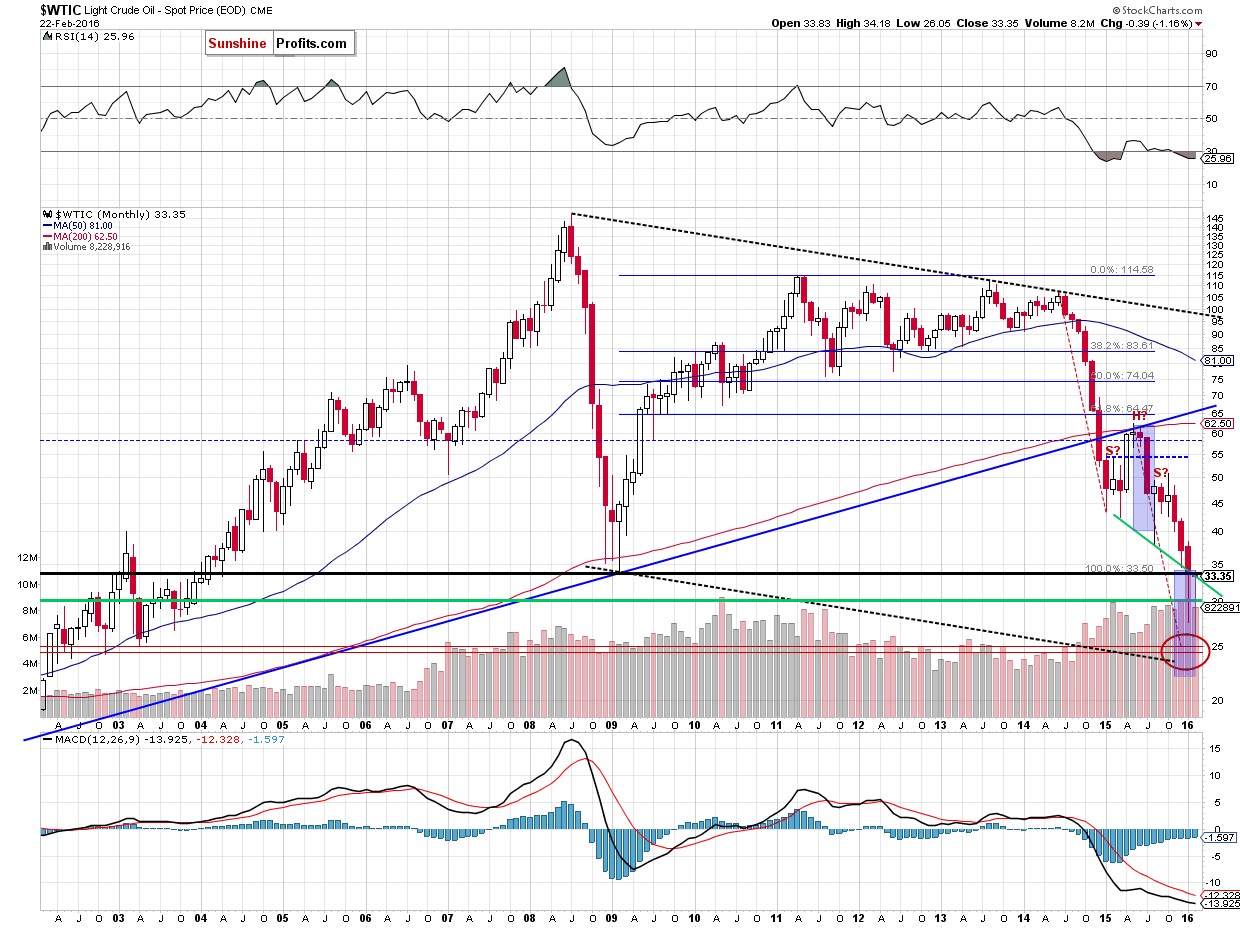
Looking at the above charts, we see that although crude oil extended gains and climbed above $33, the commodity remains under two key resistance lines: the 2009 low and the neck line of the head and shoulders formation (which means that the pattern is underway and supports oil bears). Therefore, we believe that our previous commentary is up-to-date also today:
(…) These two key resistance lines were strong enough to stop oil bulls in the previous month, triggering a decline to a fresh 2016 low. From today’s point of view, the recent upward move looks like anther verification of the breakdown below them, which suggests that light crude will decline from here in the coming week(s) – similarly to what we saw at the end of January.
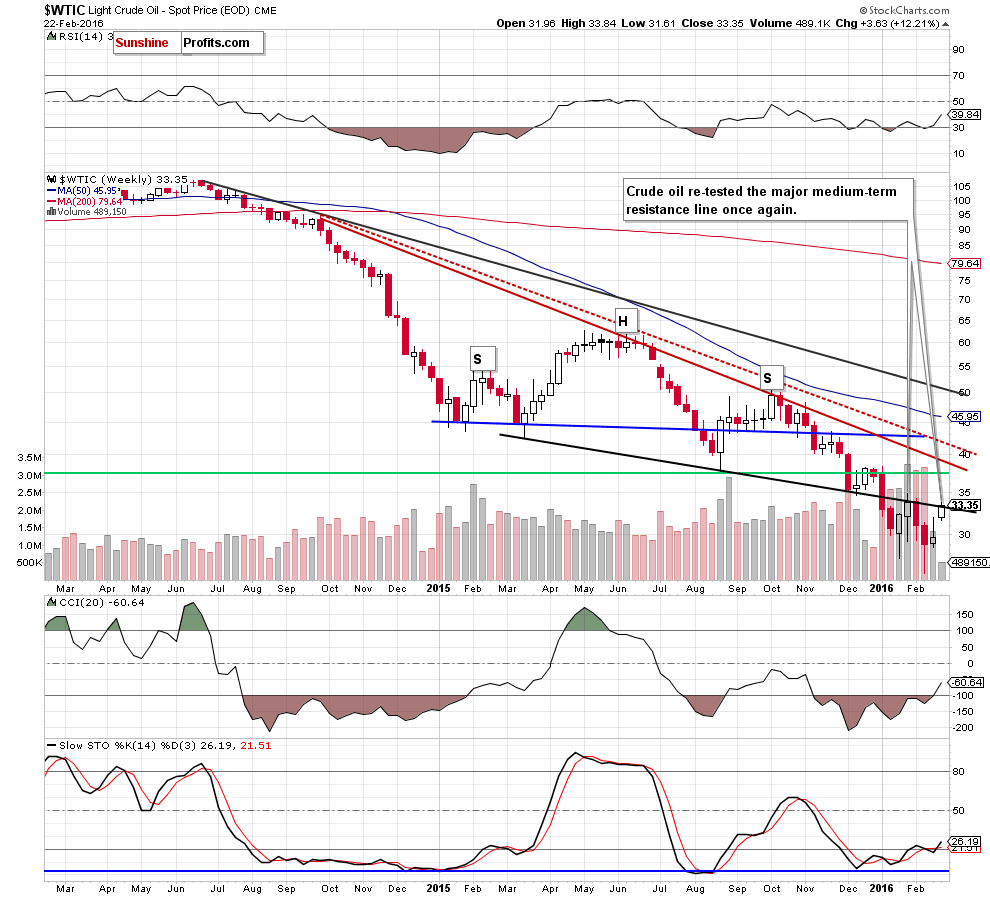
Additionally, when we compare the size of volume that accompanied these two moves (on the above weekly chart), we clearly see that last week’s rally materialized on smaller volume than the previous upward move, which suggests that oil bulls may not be as strong as it seems at the first sight.
Moreover, please note that even though crude oil moved higher last week, it didn’t move above the previous high that we saw 3 weeks earlier, which is yet another bearish sign.
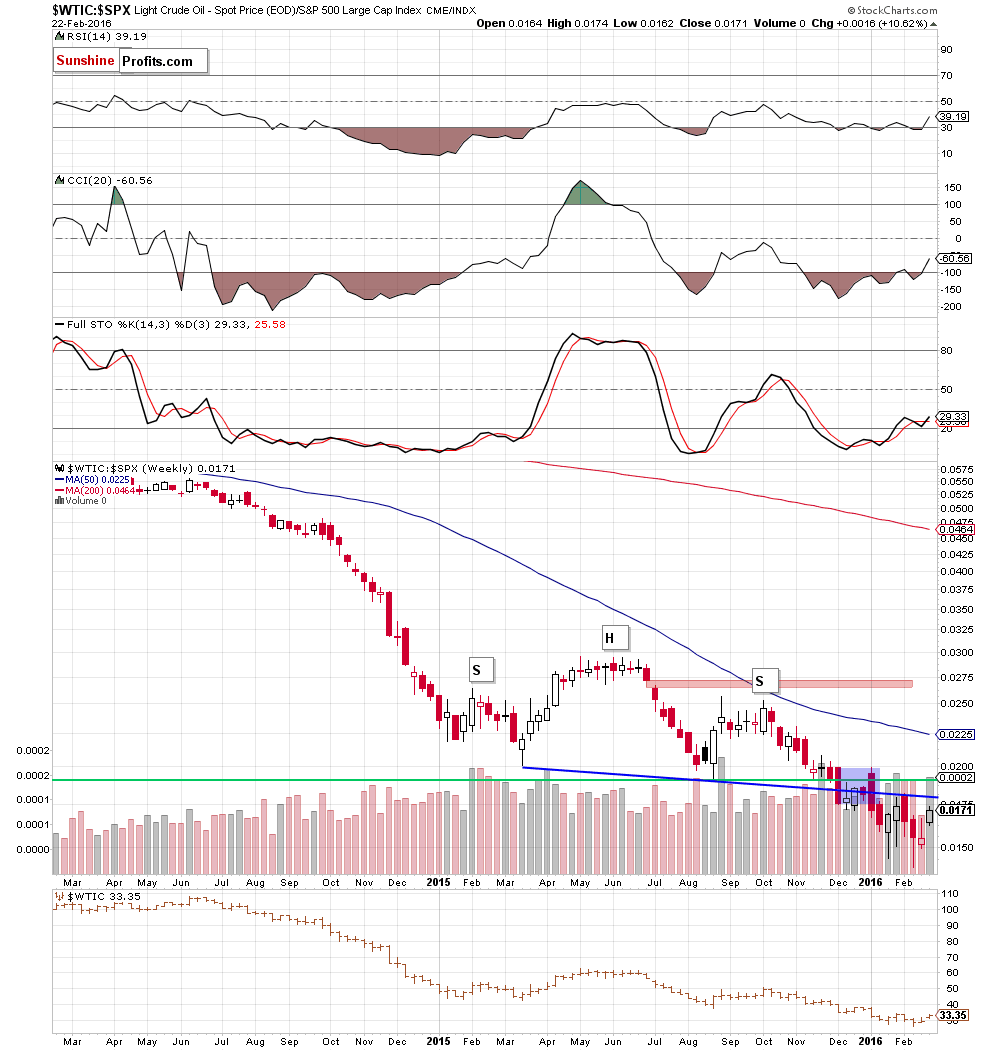
The head and shoulders pattern remains in place also in case of oil price compared to the value of the S&P 500 Index. The bearish implications remain in place – it seems that we will see even lower values of crude oil than what we’ve seen so far this year, before the decline is completely over.
Summing up, crude oil moved higher once again, but despite yesterday’s increase, the commodity remains under two key resistance lines: the black horizontal line based on the 2009 low (marked on the monthly chart) and the neck line of the medium-term head and shoulders formation. This suggests that the recent upward move could be just another verification of the breakdown and lower values of the commodity are likely. Therefore, we believe that short positions are justified from the risk/reward perspective.
Very short-term outlook: bearish
Short-term outlook: bearish
MT outlook: bearish
LT outlook: mixed with bearish bias
Trading position (short-term; our opinion): Short positions (with a stop-loss order at $35.63 and the price target at $25.63) are justified from the risk/reward perspective. The analogous levels for USO ETF and DWTI ETN are:
- USO initial target price: $6.67; USO stop-loss: $10.25
- DWTI initial target price: $513.31; DWTI stop-loss: $165.84
We will keep you – our subscribers – informed should anything change.
As a reminder – “initial target price” means exactly that – an “initial” one, it’s not a price level at which we suggest closing positions. If this becomes the case (like it did in the previous trade) we will refer to these levels as levels of exit orders (exactly as we’ve done previously). Stop-loss levels, however, are naturally not “initial”, but something that, in our opinion, might be entered as an order.
Since it is impossible to synchronize target prices and stop-loss levels for all the ETFs and ETNs with the main market that we provide this level for (crude oil), the stop-loss level and target price for popular ETN and ETF (among other: USO, DWTI, UWTI) are provided as supplementary, and not as “final”. This means that if a stop-loss or a target level is reached for any of the “additional instruments” (DWTI for instance), but not for the “main instrument” (crude oil in this case), we will view positions in both crude oil and DWTI as still open and the stop-loss for DWTI would have to be moved lower. On the other hand, if crude oil moves to a stop-loss level but DWTI doesn’t, then we will view both positions (in crude oil and DWTI) as closed. In other words, since it’s not possible to be 100% certain that each related instrument moves to a given level when the underlying instrument does, we can’t provide levels that would be binding. The levels that we do provide are our best estimate of the levels that will correspond to the levels in the underlying assets, but it will be the underlying assets that one will need to focus on regarding the sings pointing to closing a given position or keeping it open. We might adjust the levels in the “additional instruments” without adjusting the levels in the “main instruments”, which will simply mean that we have improved our estimation of these levels, not that we changed our outlook on the markets.
Thank you.
Nadia Simmons
Forex & Oil Trading Strategist
Przemyslaw Radomski, CFA
Founder, Editor-in-chief
Gold & Silver Trading Alerts
Forex Trading Alerts
Oil Investment Updates
Oil Trading Alerts

