
Trading position (short-term; our opinion): No positions.
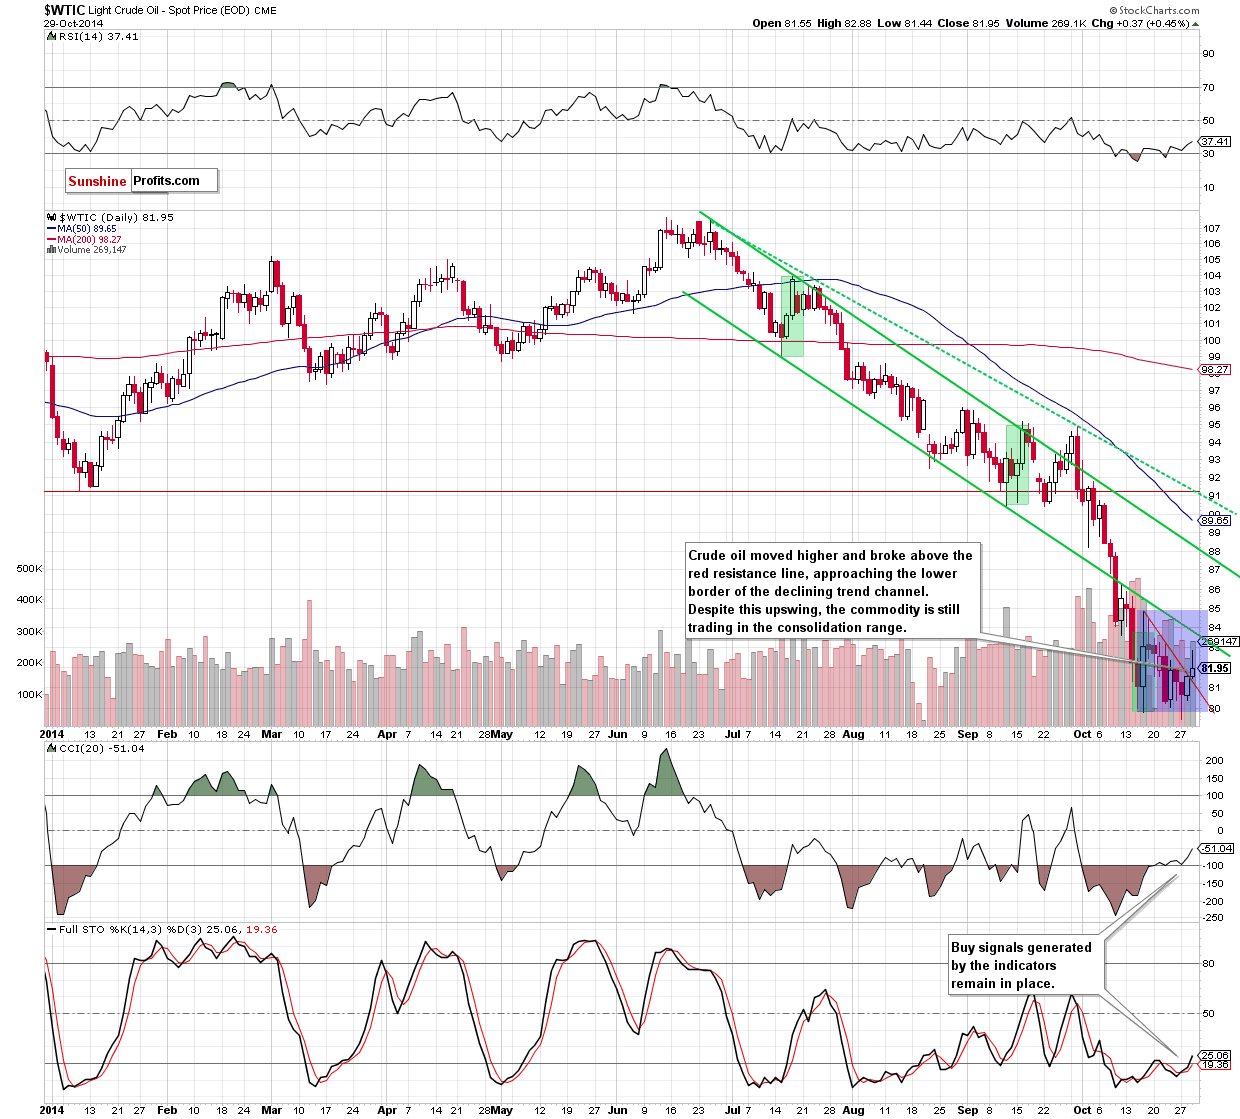
On Wednesday, crude oil climbed to almost $83 per barrel after the EIA weekly report showed a smaller-than-expected rise in domestic crude stockpiles. However, the commodity gave up some gains after the Fed statement. Finally, light crude gained 0.45% and reached the long-term resistance. Will we see a successful breakout in the coming days?
Yesterday, the U.S. Energy Information Administration showed in its weekly report that U.S. crude oil inventories rose by 2.1 million barrels in the week ending Oct. 24, missing expectations for a gain of 3.4 million barrels. Additionally, gasoline inventories decreased by 1.2 million barrels, compared to forecasts for a 1.0 million barrels decline, while distillate stockpiles fell by 5.3 million barrels. These bullish numbers in combination with a weaker greenback eased concerns over a supply glut and triggered a sharp rally, which took the commodity to an intraday high of $82.88.
Despithe this improvement, light crude gave up some gains after the Fed said it would end its monthly bond-buying program but keep rates near zero for "considerable time", which supported the U.S. dollar, making the commodity less atractive for holders of other currencies. How did these fundamental factors affected the technical picture of crude oil? (charts courtesy of http://stockcharts.com).
Quoting our previous summary:
(…) although crude oil rebounded slightly, the commodity is still trading under the solid resistance zone (…), which could pause or stop further rally - similarly to what we saw earlier this month.
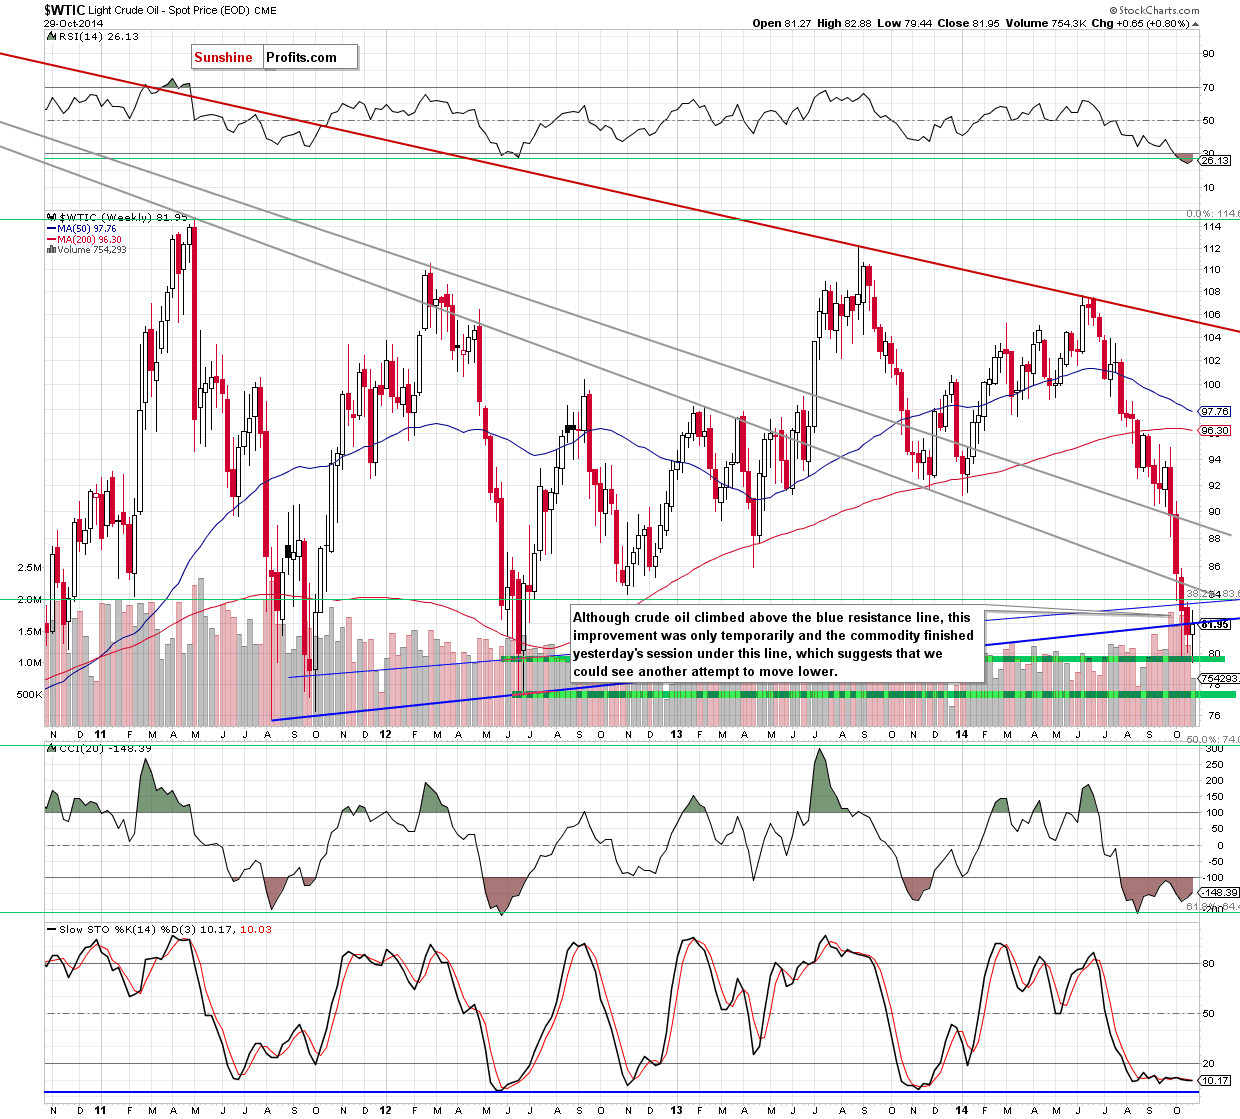
Looking at the above charts, we see that the situation developed in line with this scenario as crude oil reversed after a rally to almost $83. As you see, the proximity to the last week’s high and the lower border of the declining trend channel was enough to trigger a pullback and a drop below $82. In this way, crude oil invalidated earlier breakout above the blue long-term resistance line (seen on the weekly chart) and closed the day slightly below it. This is a negative signal, which suggests that we could see another attempt to move lower. If this is the case, the nearest support would be the very short-term declining red line (marked on the daily chart) around $81.
Please keep in mind that as long as oil bulls do not close the week above the long-term blue line and there is no breakout above the upper line of the consolidation (marked on the daily chart), another sizable upward move is questionable.
Summing up, although crude broke above the long-term blue resistance line, this improvement was very temporarily and the commodity reversed, invalidating earlier breakout. As we have pointed out before, this is a negative signal that suggests another attempt to move lower. In our opinion, a sizable (and profitable) upward move will be more likely after a breakout above the lower border of the declining trend channel and the long-term resistance lines, which together create a solid resistance zone. Therefore, staying on the sidelines is the best choice at the moment.
Very short-term outlook: mixed
Short-term outlook: mixed
MT outlook: mixed
LT outlook: bullish
Trading position (short-term; our opinion): No positions.
Thank you.
Nadia Simmons
Forex & Oil Trading Strategist
Przemyslaw Radomski, CFA
Founder, Editor-in-chief
Gold & Silver Trading Alerts
Forex Trading Alerts
Oil Investment Updates
Oil Trading Alerts

